Insurance v1 | Zenoptics
logo

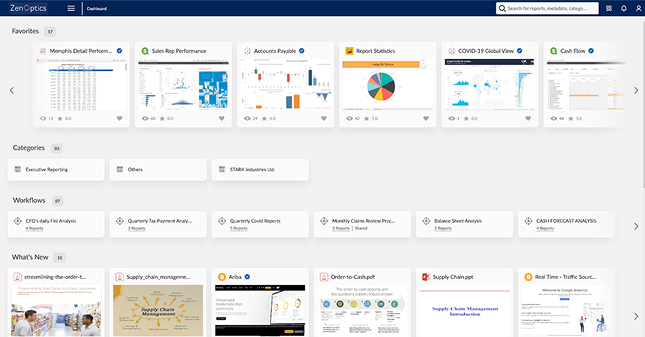
Discover. Govern. Optimize.

One platform to inventory every analytics asset, retire duplicates, certify what is trusted, and prove access in seconds.

“GAP Group has been progressing through a data modernisation journey, transitioning from on-premises legacy systems to hybrid cloud solutions. Our previous reporting platform consisted of over 1,600 reports aggregating data from multiple systems. However, it was inflexible, outdated, and lacked user-friendliness. Read more

We set out to find a modern solution that aligned with our vision of delivering a single-pane-of-glass view of all reporting assets — one that could serve the diverse needs of our user base, from service technicians in depots to power users in our finance teams. Key requirements were to introduce robust governance, streamline our reporting estate, and minimise disruption to the end-user experience during the transition.

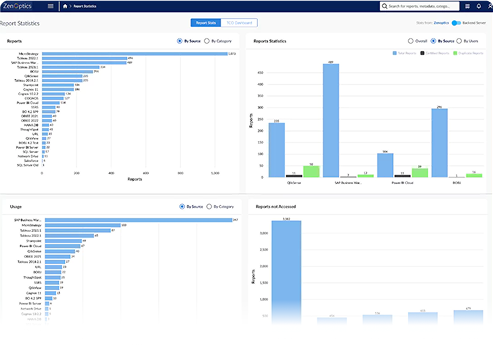
The ZenOptics platform has fully met these objectives. It has significantly improved the user experience, introduced powerful search capabilities, and enhanced governance across our report release lifecycle. Using data usage reporting and metadata analysis GAP were able to rationalise low value reports removing 24% of the legacy reports and in a recently conducted user satisfaction survey 88% of respondents rated the system as Very Satisfied.” Read Less

— Mark Emery, Group Data & Analytics Manager, GAP Group
Ready to see everything you own, cut the clutter, and give users exactly the reports they need?

Complete the form to schedule a 30-minute live demo.

Why teams choose ZenOptics

Analytics assets are spread across multiple tools, causing duplicated work and uncertainty about which version to trust. ZenOptics provides a unified platform that centralizes and curates trusted reports, dashboards, and KPIs for easy discovery and confidence in decision-making

team-choose

Who it is built for

CDAO, CAO, CDO, CIO.

Create a governed analytics foundation that is ready for AI.

CISO

Enforce role-based access and monitor report usage.

IT and BI Managers

Slash BI license waste and govern enterprise analytics.

Data and Analytics CoE

Remove duplicate content, streamline access, and standardize KPIs.

DPO

Track data lineage to support privacy obligations.

Analytics engineers and data stewards.

Automate lineage, ownership, and security mapping.

GRC

Meet audit requirements and reduce operational risk.

What is slowing your team and how to remove it

people-cannt
People cannot find the right report or dashboard.

One glossary for every approved term and definition.

conflicting
Conflicting definitions stall decisions.

Tag owners, definitions, and refresh schedules so each KPI has one meaning.

report-dash
Too many versions of the same report or dashboard.

Identify and remove duplicates.  Direct everyone to certified analytic assets.

audits
Audits take weeks.

Export lineage and access history from a single repository instead of stitching logs together.

Platform pillars

Analytics Ops

Find, fix, and fast-track every analytics asset in minutes, not weeks.

  • Instant usage assessment and inventory of analytic assets. Connect once and continuously harvest metadata from Tableau, Power BI, Qlik, SAP BO, Looker, Excel shares, and more. No agents, no coding.
  • Identify duplicate and stale reports and dashboards. Machine learning algorithms identify redundant dashboards and reports you can retire to cut clutter and cost.
  • Lineage and impact analysis. Trace every report back to its source tables and transformation steps.
  • Usage and license analytics. Understand who really uses which analytic assets and right-size platform spend before renewal.
  • Foundation for Catalog and Governance. The cleansed, enriched inventory of analytic assets powers ZenOptics Catalog and Governance.
analytics-Ops
analytics-catalogg
Analytics Catalog

Curate, Catalog and control every BI asset from one searchable platform.

  • Harvest metadata, security settings and usage from the originating BI tools.
  • Curate and organize analytic assets for discoverability.
  • Connect to data catalogs to provide comprehensive lineage for analytic assets
  • One glossary for approved terms and definitions.
  • Catalog every asset with search, filters, tags, and lineage views.
Analytics Governance

Manage, certify and control every KPI, report, and dashboard in the Analytics Catalog.

  • Enrich each analytic asset with owner, sensitivity, and business context.
  • Certify KPIs, reports and dashboards in the Analytics Catalog.
  • Role-based control and full audit trails show who viewed what, when, and why.
  • Analytics usage monitoring to flag stale or noncompliant content and non-usage
  • Act by retiring duplicates, certifying trusted content, and assigning ownership.
analytics-governancee

How It Works

1

Connect your BI platforms, reporting applications and shared drives through the ZenOptics Connector Framework.

2

Harvest metadata, security settings, and usage logs automatically.

3

Identify duplication, lineage, and usage hot spots in interactive views.

4

Act by retiring duplicates, certifying trusted content, and assigning ownership.

5

Govern with role-based permissions, glossary alignment, and exportable audit trails.

What you get

From OPS
  • Unified analytics inventory: Less than 24 hours.
  • Duplication and redundancy analysis: By Day 2.
  • Report lineage maps: By Day 3.
  • Usage and license dashboard: By Day 4.
  • Executive optimization briefing: By Day 5.
From Catalog
  • Streamlined user experience: Increase in analytics adoption.
  • Unified catalog of curated analytic assets: Single source of truth.
  • Federated enterprise search and filters: Faster report discovery.
  • Communication associated with each analytic asset: Enhanced collaboration.
  • Certification workflow. Trusted and shared analytical business workflows.
From Governance
  • Standardized business glossary: Consistent definitions.
  • Certified cross-platform KPIs, reports and dashboards: Trusted metrics and analytic assets
  • Attribute-rich analytic asset inventory. Faster impact analysis.
  • Role-based access controls. Lower security risk.
  • Exportable audit reports. Quicker compliance.
Signs you need a unified analytics platform

If any of these rings true, it is time to talk.

  • Users cannot find or trust reports.
  • Overlapping BI tools with no shared view.
  • More than 30 percent of dashboards are duplicates.
  • Audits demand weeks of manual effort.
  • Analysts spend over 40 percent of their time on support.
Governance check

If any of these sound familiar, Governance is your next priority.

  • Different teams define the same name KPI in different ways.
  • Auditors ask for lineage or access proof that you cannot produce quickly.
  • Security reviews show unclear report permissions.
  • Business terms and definitions live in spreadsheets, not a governed dictionary.