


The proliferation of self-service business intelligence (BI), embedded analytics, advanced analytics, and other software technologies that provide analytics are commonplace in organizations large and small. Yet many individuals within these organizations struggle to understand what analytics are available, where they can be found, and what information they provide.
To address these needs, analytics catalog technology was created to compile a listing of analytic assets that are rendered or made available via a BI Portal. Behind the scenes of the technology, an analytics catalog captures and stores the metadata about each of the analytic assets to provide standardization and additional context for consumers of the information.
Digital Documents vs Analytics Assets
Not all digital documents within an organization are analytics assets. For example, a single-purpose document, such as an employee expense report for the month of November or an October customer purchase order, is static and stored as supporting information in the accounting system of an organization.
An analytics asset is a structured report, dashboard, or visualization that provides information from a data repository. For example, a customer report may list the customer names and the amount of revenue generated for a specific time period. The customer report could be run to display information for the month of October (or whatever time period is desired).
The advent of self-service BI unleashed the ability for anyone with access to the business information to create analytics assets—rather than relying on someone from IT for assistance to build a report or dashboard. While IT no longer was a “bottleneck” for these resources, the discipline of consistently substantiating and validating the accuracy of an analytics asset was lost; this was the trade-off of embracing self-service BI—a challenge that we still grapple with today.
Curating Analytics Assets
It is not uncommon for organizations to have multiple BI tools and applications that serve as best-in-class technology for rendering information in a meaningful manner. While it is a best practice to deploy the appropriate technology for a specific purpose, each tool, application, and platform contains a tremendous quantity of analytics assets available for use.
Many organizations that we work with have thousands to tens of thousands of analytics assets that have been created as a direct result of self-service BI and that exist in a variety of underlying sources. Yet self-service also introduces challenges. If an individual can’t find exactly what they looking for, they simply create a new one—one that may be a duplicate (or very similar).
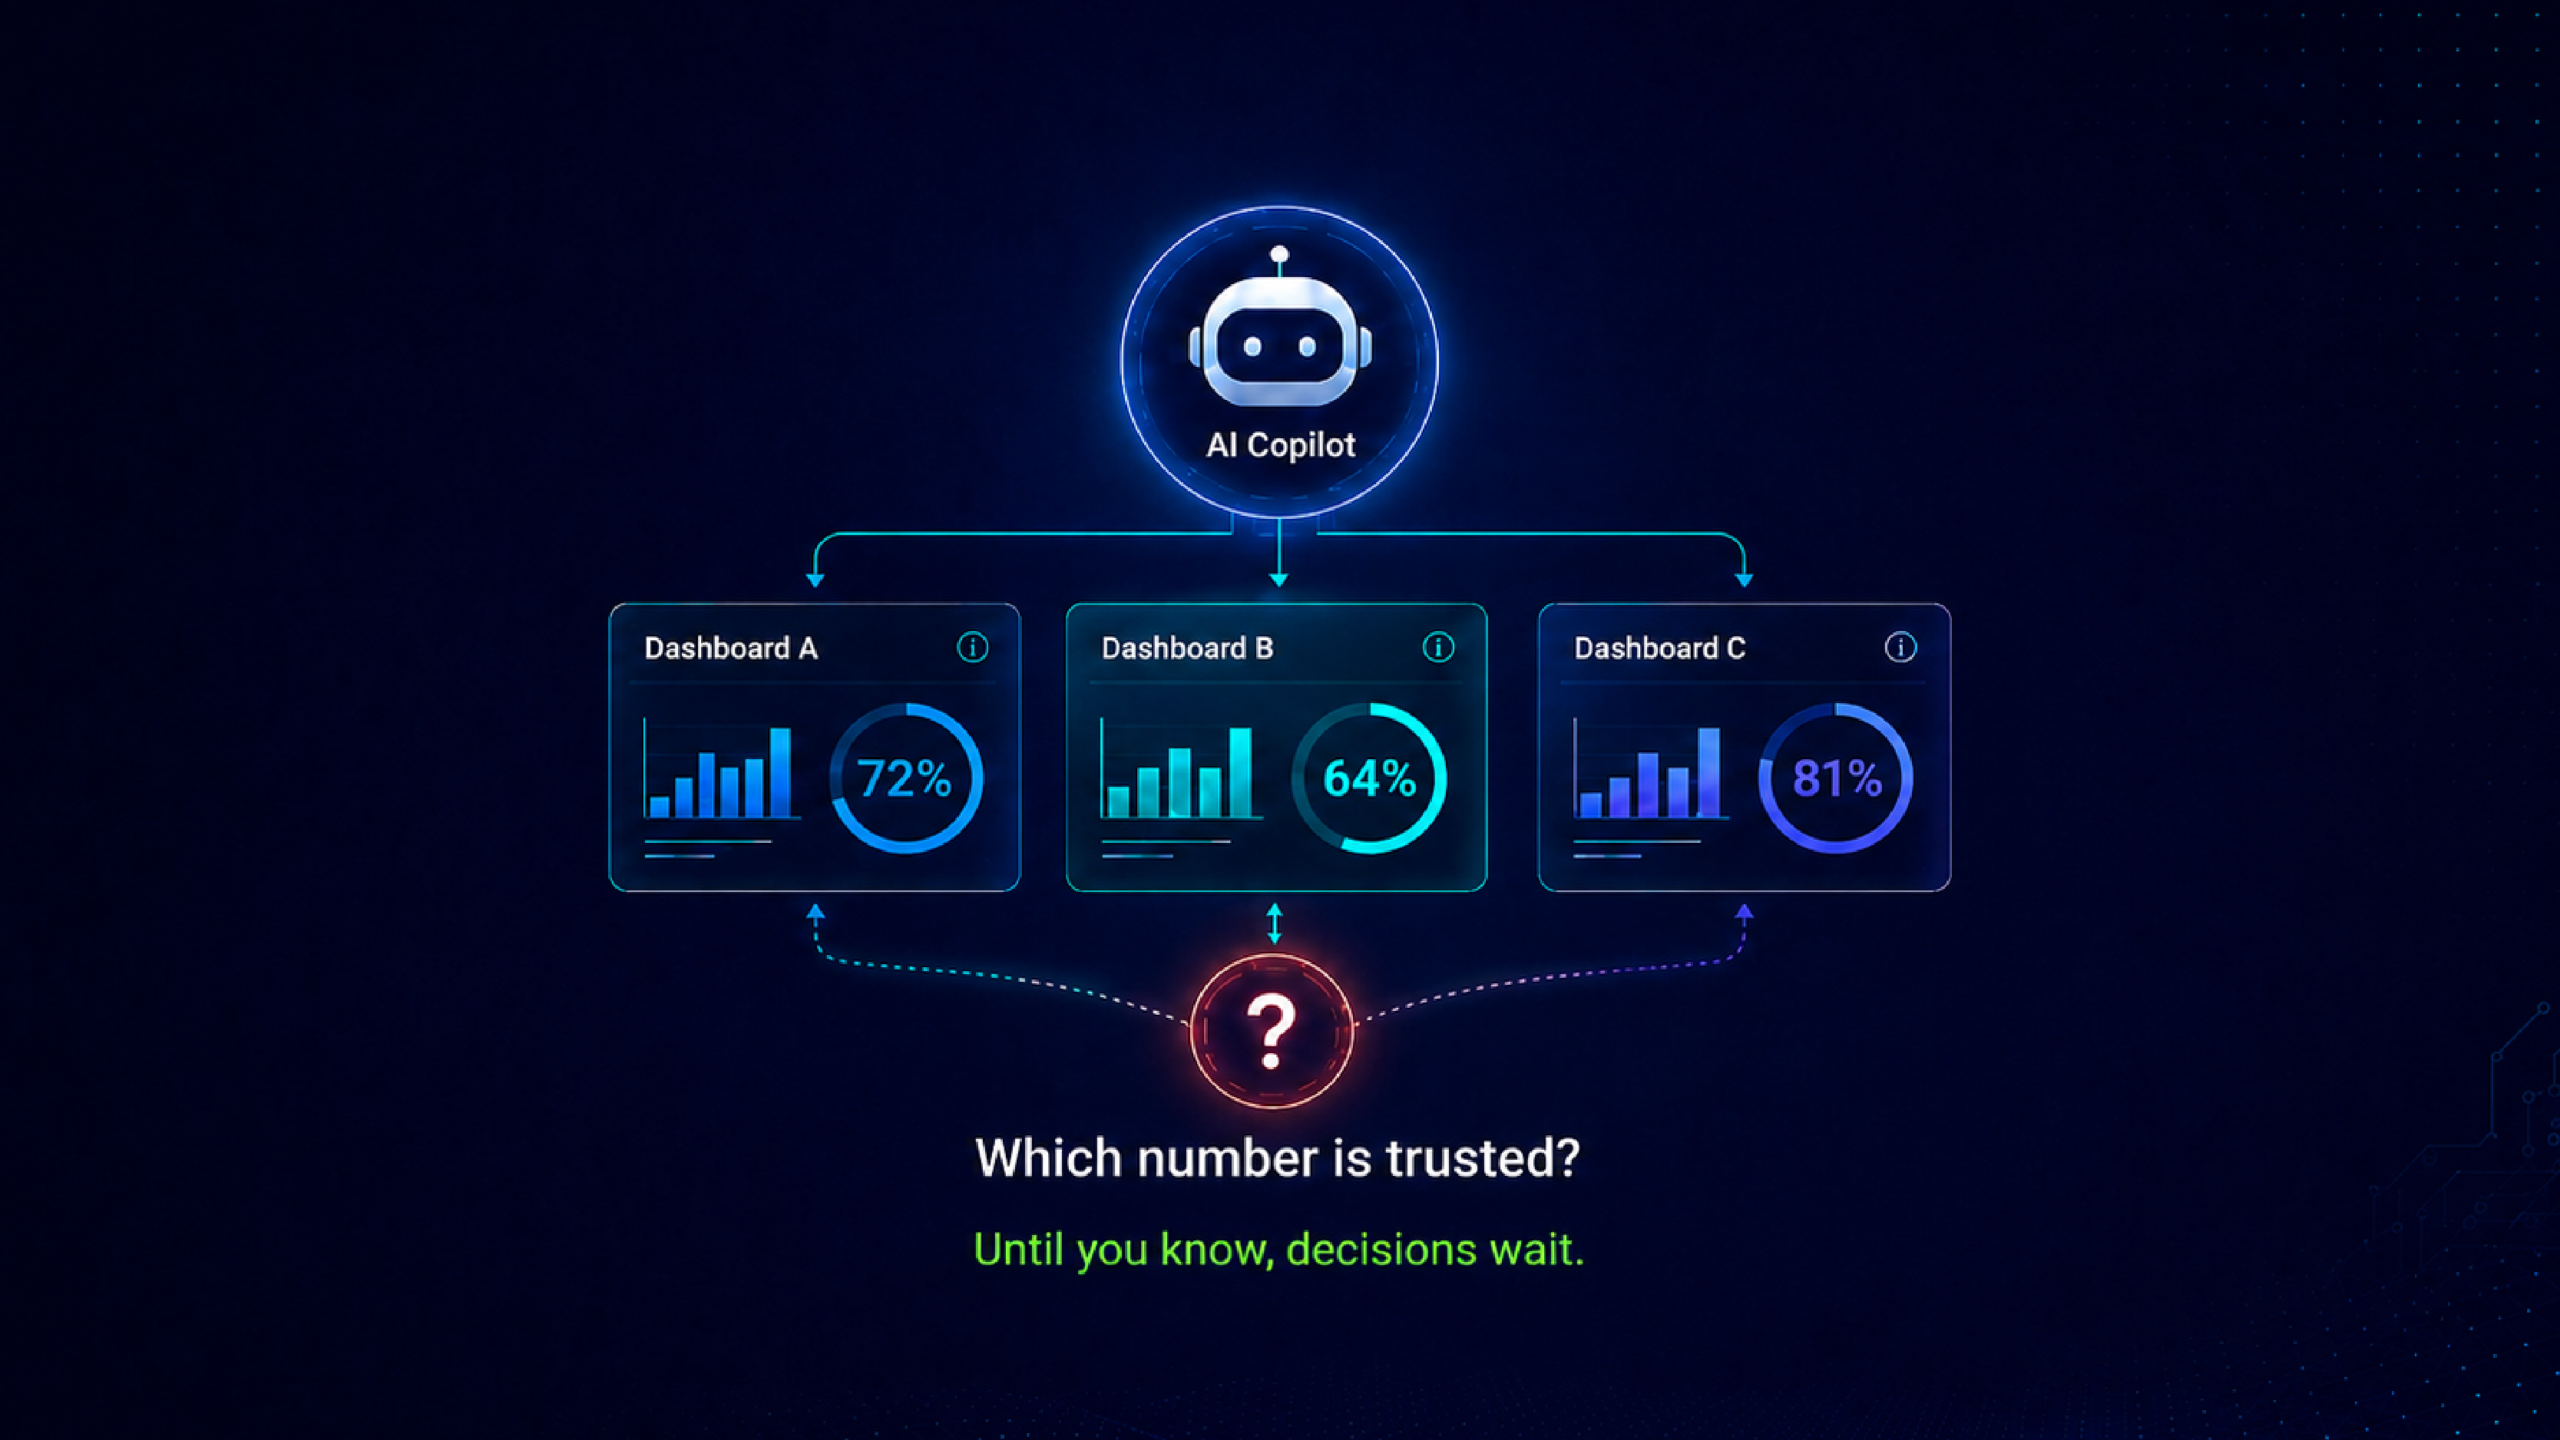
An additional challenge is that, in many cases, analytics assets have the same name with different content or different names with the same content. In either case, figuring out which analytics asset to use and trust is challenging and time-consuming.
For example, an analytics asset named “Revenue Report” may display gross revenue, net revenue that is gross revenue less discounts, or some other variation. Unless there is a good description of the report and the identification of the business owner who can be contacted with questions, trying to figure out if the revenue displayed is gross, net, or something else is an exercise in frustration.
The purpose of an analytics catalog is to address these types of challenges. A best practice for implementing an analytics catalog is to curate the assets before publishing them within the analytics catalog. The process of curating is applying a discipline of reviewing each analytics asset and ensuring that the:
- Analytics asset is relevant, needed, and will be used.
- Name is distinct and accurate.
- Description is informative with additional information including the names of the report producer and business owner.
- Underlying data source is secured, correct, and appropriate.
- Business rules applied to the underlying data within the report are correct.
The exercise of curating analytics assets is also a critical component of an analytics governance program that ensures decision-making and analysis are performed using trusted and certified assets.
Organizing Analytics Assets
Once analytics assets have been curated, the next step is for the items to be organized in a manner that is intuitive and useful for individuals to search and discover. A best practice is to create a process of organizing analytics assets by subject matter, business function, business unit, legal entity, or whatever systematic structure that is meaningful to your organization. Organizing analytics assets provides a structure for access, context, and usage.
Categorizing Analytics Assets
After an overarching structure of the organization has been defined, the next step is to create categories within the analytics catalog. For example, if an enterprise software company wants to organize its analytics assets by business function then its categories would be:
- Marketing
- Sales
- Customer Success
- Research and Development
- Product Engineering
- Administration
- Finance
- Human Resources
- Information Technology
Creating categories and then subcategories classifies analytics assets in a meaningful manner for individuals needing that information.
Benefits of an Analytics Catalog
The curation, organization, and categorization of analytics assets in an analytics catalog facilitates the discovery and usage of trusted analytics assets that are available for business users and provides information about where they are sourced or produced as well as the business and technical definition. An analytics catalog combined with a BI Portal establishes a single interface for users to access enterprise analytics assets and search by name, category, content, and/or metadata. As a result, individuals can discover the analytics assets that they have access to as well as those that they don’t have security permission. In those cases of non-access, users can request permissions directly within the tool, and a steward (or organizational role) will assess the appropriateness of the request.
Conclusion
The combination of a BI Portal with an analytics catalog lays the foundation of an Analytics Hub that ultimately provides increased usage of BI; greater efficiency, productivity, and confidence in working with analytics assets; and improved decision-making capabilities.
Read our Brown-Forman customer case study to learn about their journey and benefits, both qualitative and quantitative, in implementing ZenOptics. To learn about the comprehensive benefits of Analytics Hubs in driving value from analytics investments, please visit Resources.
Published January 27, 2023