ZenOptics was recognized as a Sample Vendor in Gartner® Hype Cycle™ for Data and Analytics Governance, 2026 | Learn more


The Analytics Catalog is the essential technology to create a curated inventory of existing analytic assets that are accessed through a BI Portal – along with appropriate metadata for enhanced, contextual understanding of terms, metrics, and Key Performance Indicators. This establishes a common glossary of terms and KPIs for consistency and standardization, along with the ability to contextualize the information through a guided stewardship process. An Analytics Catalog is often also referred to as a Report Catalog.
Through a single interface, a Business Intelligence Portal or BI Portal provides individuals with direct access to a variety of analytics assets, including reports, dashboards, spreadsheets, applications, and data, which simplifies and streamlines the daily work of analysts and businesspeople, thereby increasing productivity and efficiency. This is also sometimes referred to as an Analytics Portal or Reports Portal.
A data catalog is created for the inventory of data that an organization collects and processes, such as customer name, product codes, etc., whereas an analytics catalog is focused on the inventory of analytics assets in the form of reports, dashboards, spreadsheets, and documents along with their associated metadata. Typically (outside of specific use cases), a business user will not necessarily be interested in the raw data elements, but rather in the output of those elements in the form of a report, spreadsheet, or other analytics asset. Therefore, the cataloging of such analytics is crucial to provide the contextual, standardized information associated with those assets.
An Analytics Hub is a software platform that enables productivity, manageability, collaboration, and governance. The foundation of an Analytics Hub is a set of application layers that provide rich capabilities for individuals to search, discover, interact, and analyze information. These application layers are BI Portal, Analytics Catalog, Analytics Collaboration, Analytics Automation, and Analytics Governance, which are critical to delivering a cohesive, intuitive analytics experience for decision-making.
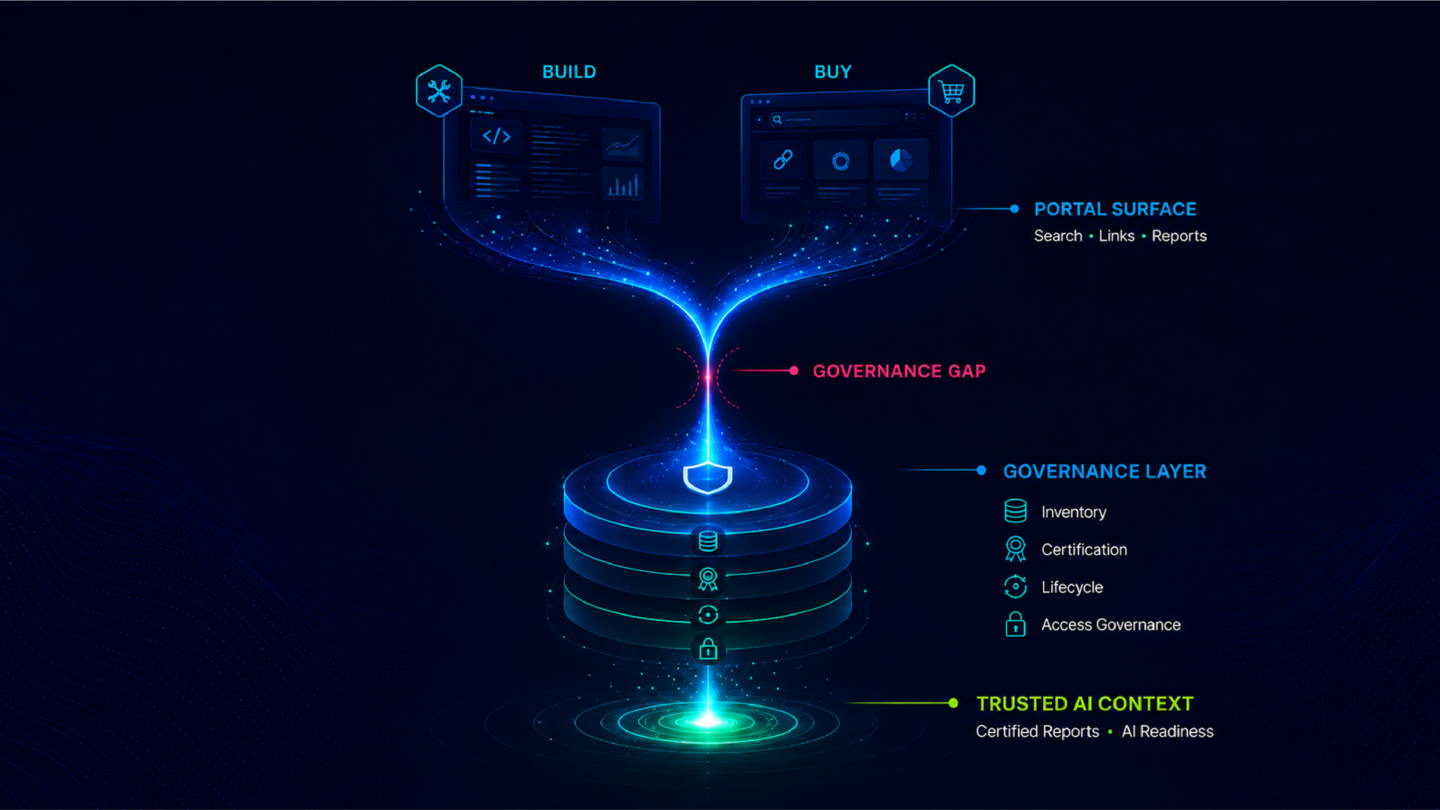
Analytics governance is a term encompassing the policies, processes, and procedures to manage the lifecycle of analytics and reports within an organization. It enables stewards to monitor and manage the usage of content across the entire analytics pipeline. Within the ZenOptics platform, our report governance and structured activities workflows for review and certification allow governance organizations and stewards to establish confidence that the information within reports/dashboards is appropriate for use. Consequently, this enables business users to work within the guardrails of sustained processes and guidelines.
A unified view of analytics is the ability for individuals to discover and access the reports, dashboards, spreadsheets, and other analytics assets they need from one centralized interface. As organizations advance their data and analytics strategy, many companies face a complex ecosystem of multiple tools and solutions to support analytics. This creates confusion and complexity for analysts and business users as they try to find, access, and understand the right information to make sound business decisions.
Report optimization and rationalization is the process of determining the relevance and usefulness of a report. Often in a data and analytics ecosystem, a proliferation of reports exists - often in a variety of tools. Report rationalization involves reviewing usage statistics and user feedback to make an assessment of the relevance of the analytic asset, and ultimately clean up the analytics environment. This ultimately reduces cost and effort of maintaining complex, sprawling environments as well as confusion for end users attempting to find the right information for business decisions.
Analytics collaboration provides individuals with communication tools, the ability to discover and connect with subject matter experts related to a certain topic, and connect and share resources directly with individuals and teams – all within the established governance and security parameters.
Analytics automation supports the assembly of analytic assets from the analytics catalog into groupings that support complex analyses and/or business processes. The automation streamlines the launch and refresh of the information needed for process-driven analytics needs. This enhances the user experience and improves productivity.
ZenOptics offers a comprehensive Analytics Catalog that combines data and analytics assets (such as reports, dashboards, spreadsheets, etc.) from many sources, which effectively addresses data silos. By providing a centralized access point, ZenOptics ensures that business users can easily find and access the correct information, breaking down the boundaries between several data systems.
ZenOptics provides enterprise-grade security, compliant with industry standards to ensure that all analytics assets and related data are safeguarded while allowing users to access resources inside safe governance limits. The ZenOptics platform inherits user permissions from the source tool/application and provides single sign-no via industry standard authentication protocols, and supports safe data sharing with advanced encryption
ZenOptics is designed to integrate with corporate applications, data sources, and business intelligence solutions. Our proprietary connectors automatically bring in the report, dashboard, visualization, report, spreadsheet, PDF, etc. – as well as the associated metadata to preserve context and understanding of the analytic asset.
In doing so, ZenOptics establishes a unified platform that allows you to access, manage, and organize all of your analytics assets regardless of the tools used to generate them. The result is enhanced usage and value of your existing BI and analytics resources.
ZenOptics is ideal for businesses in any industry who want to streamline their analytics systems and improve analytics adoption and use. By providing a single source for users to easily find and access information from across any connected information source, ZenOptics helps companies effectively and profitably promote and manage their analytics assets.
ZenOptics relies primarily on metadata for the context, definitions, and classification of analytics assets. This metadata makes reports, dashboards, and other assets more accessible, enabling business users to quickly understand the source, meaning, and value of the data for decision-making.
ZenOptics enables business users to easily find, access, and use analytics assets on their own. This self-service discovery and access of information combines with governance and stewardship functionality within the ZenOptics platform to ensure that users can make informed decisions in line with corporate policies and best practices.
In the context of data and analytics, self-service discovery is the ability for an individual to easily identify, locate and review enterprise information and analytic assets in the form of reports, dashboards, visualizations, spreadsheets, and documents from a single discovery and access.