ZenOptics was recognized as a Sample Vendor in Gartner® Hype Cycle™ for Data and Analytics Governance, 2026 | Learn more
ZenOptics Analytics Hub is used by enterprises across many different industries to help them solve specific data and analytics challenges.
Here are the top use cases delivering the most value for our customers.
Request Demo
As organizations look to modernize their existing BI and analytics environments, the ZenOptics platform provides meaningful ways for organizations to realize greater value from their data and analytics investments through the following use cases:
Most companies have reporting environments with various BI tools and applications. With thousands of analytics assets spread across multiple tools, business users don’t know where to find the information they need for analysis and decision-making. This causes uncertainty, frustration, and lost productivity.
With self-service BI and analytics, the volume of reports and dashboards increases dramatically over time. Further, the reports existing in the ecosystem often remain unmanaged over time as people rarely retire unused or outdated assets.
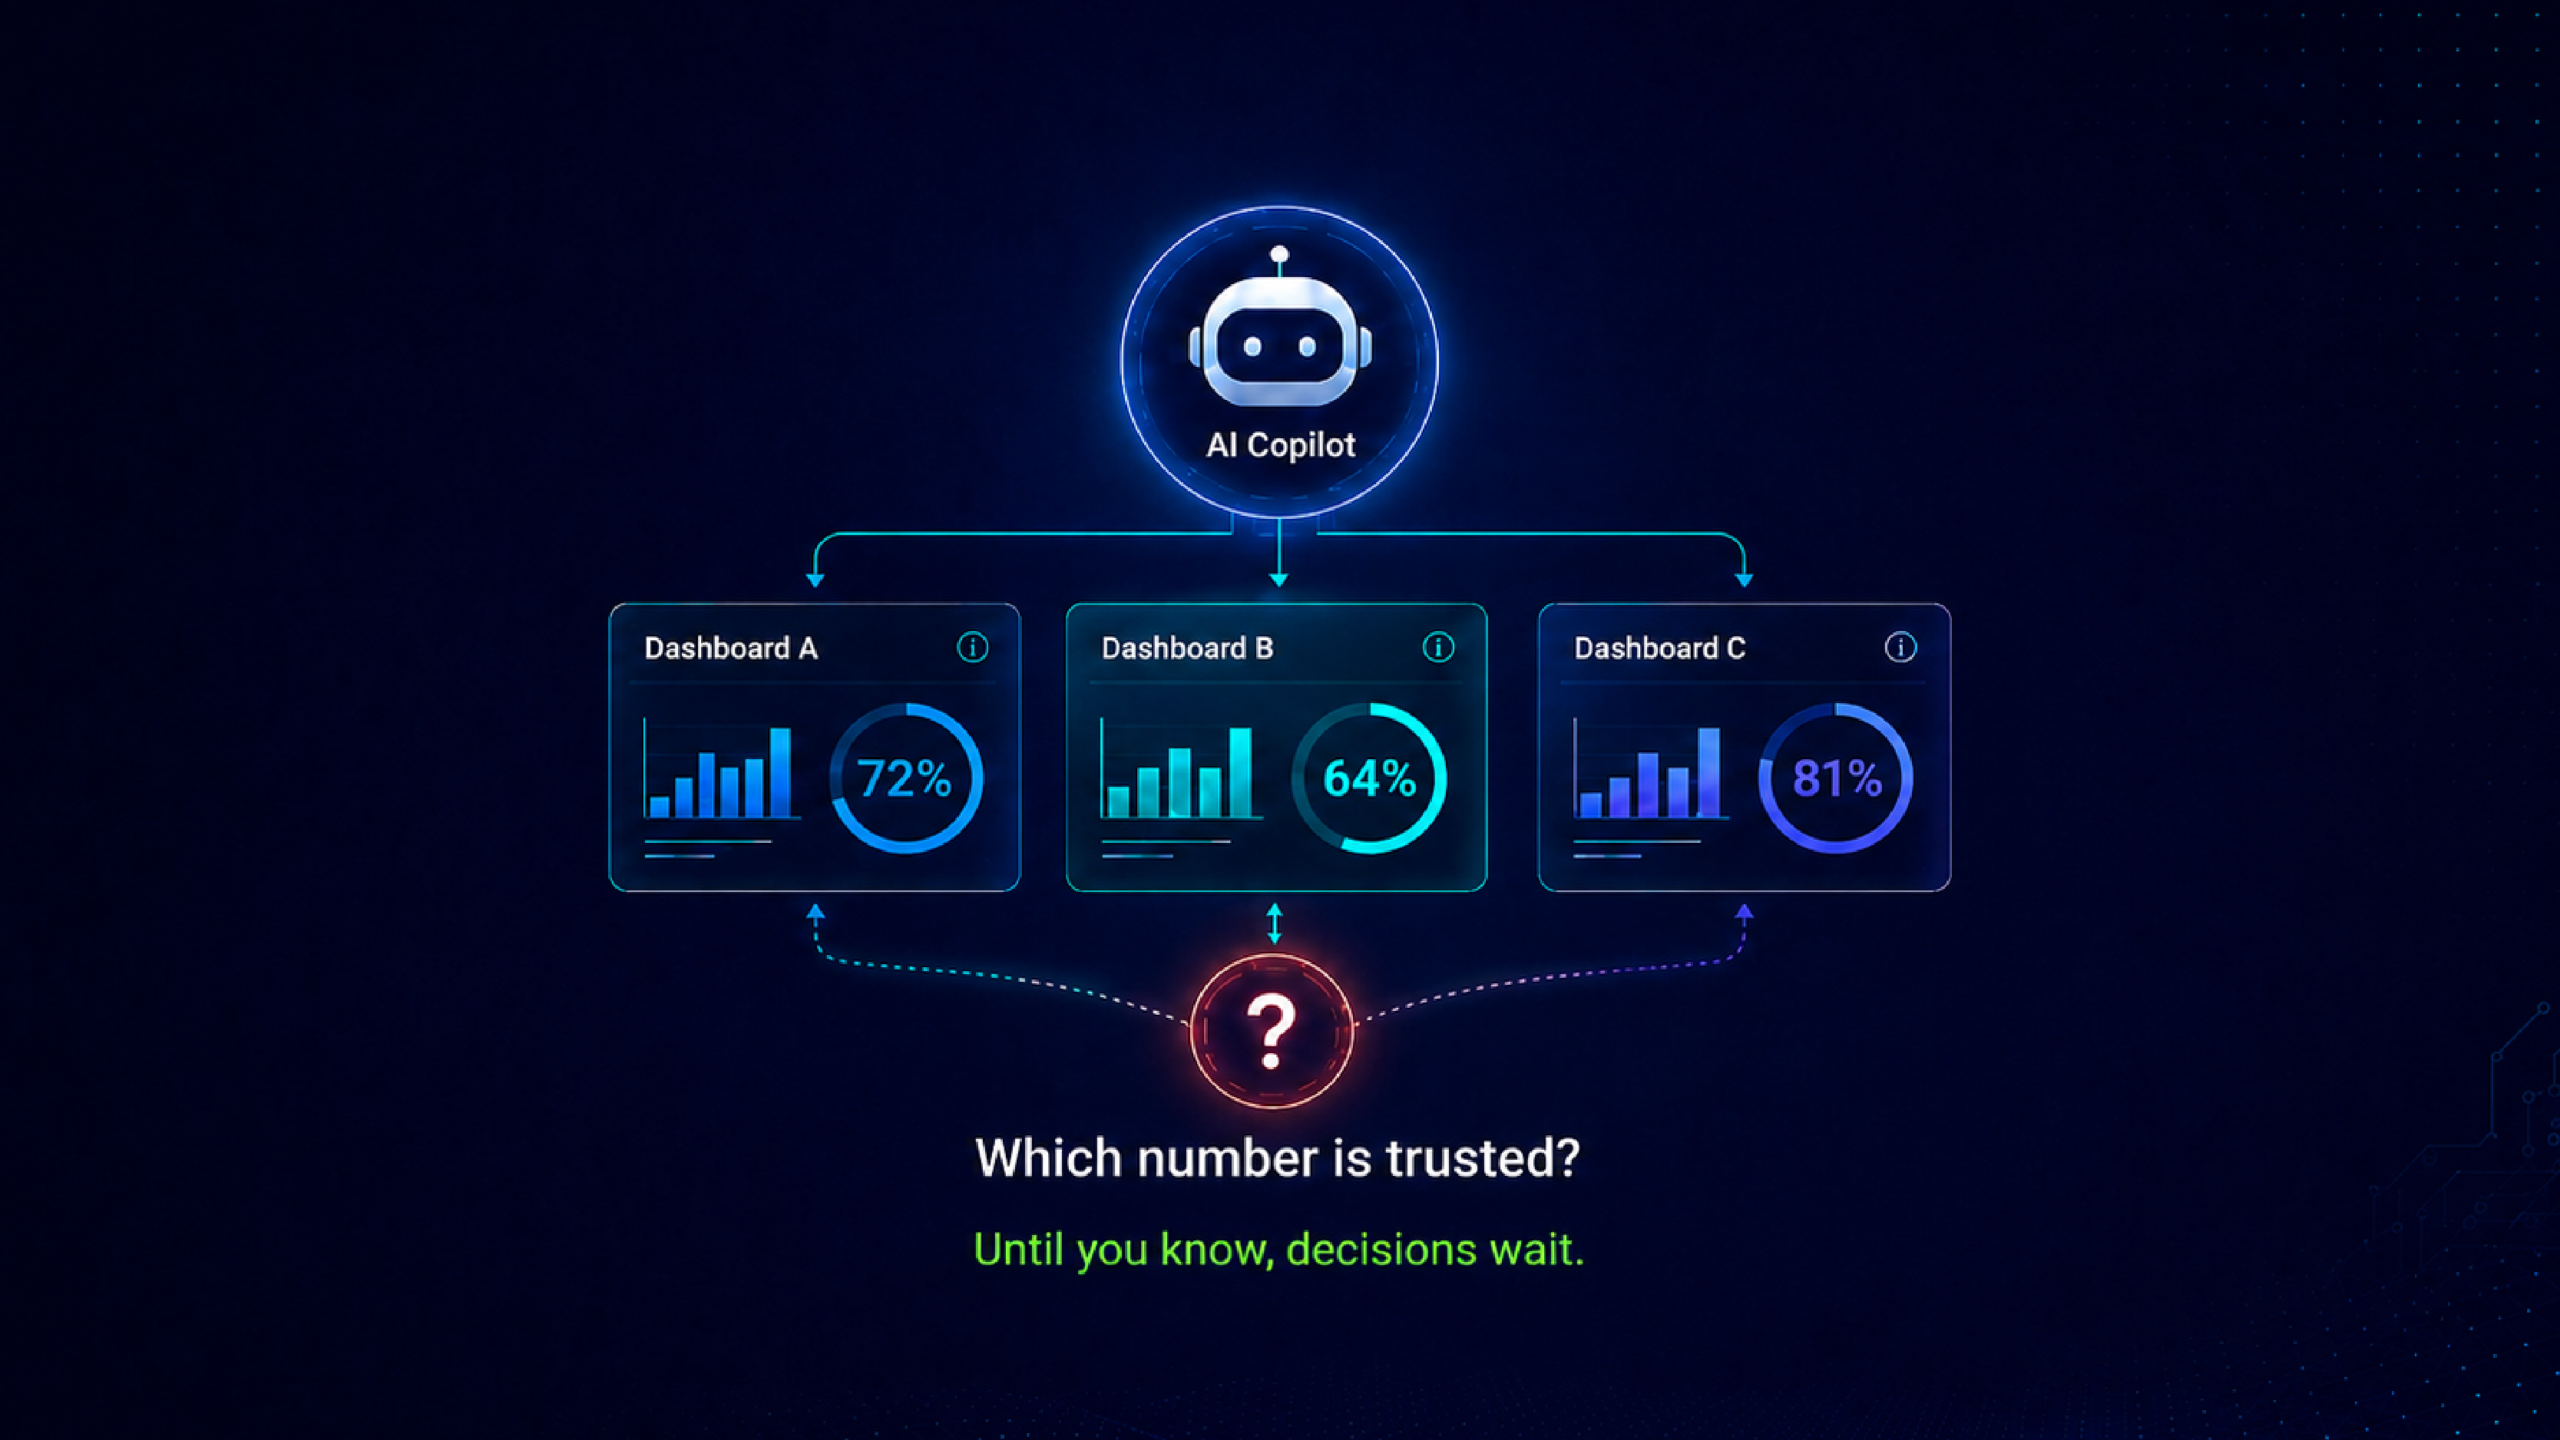
As a result, people can’t find the information they’re looking for or – worse – select a report that hasn’t been validated, which undermines the integrity of the overall reporting environment.
Key Performance Indicators are essential measures to evaluate and manage the performance of enterprise activities and operations. Executive teams, managers, and stakeholders all need to easily access these measures in a consistent, organized manner to create standardization and common understanding across the enterprise.
Inconsistencies with KPI definitions and calculations cause wasted time spent resolving misunderstandings and disputes - not to mention the risk of incorrect decisions about performance.
As organizations modernize their BI and analytics environments, new tools are often introduced and legacy tools may be retired. This is a complicated and time-consuming process, as organizations try to understand and address the incredible volumes of existing analytics assets.
As organizations plan to transform the way they do business, the following use cases describe how ZenOptics platform helps to facilitate those efforts:
An enterprise data and analytics marketplace is the bridge between a data catalog and an analytics catalog so that report producers, business analysts, managers and executives have a single virtual repository for accessing data sets and analytics assets.
Data catalogs are highly technical applications that are built primarily for data engineers. They are complex, technical solutions that most business analysts would struggle to work with.
The ability to combine data sets within the business-user-focused Analytics Catalog enables organizations to have a full marketplace of data and analytics resources.
Defined business processes are the foundation for organizations to run smoothly and scale effectively. Ensuring that the same reports are easily accessible and used consistently over time is critical – especially for processes such as regulatory reporting. Yet it is inefficient, time-consuming, and potentially inconsistent when manual effort is required to gather data from disparate sources. This increases the risk of errors and incorrect information being used for analyses and decision-making.
Organizations realize that data governance is a component to ensure people use the right information to make informed decisions. Beyond the data itself, an ungoverned reporting environment creates report sprawl and introduces risk and uncertainty when accessible reports may be inaccurate, outdated, or inappropriate for certain uses.
Governing the lifecycle of analytics resources is a disjoined process, and without visibility into the usage, relevance, and appropriateness of the information, it’s difficult for a governance program to be successful and sustainable.
Integrating information from multiple organizations into a single view of the combined enterprise is challenging and complex. Each organization has its own set of data and analytics – including the tools, structures, and processes – that must be rationalized and combined.
This creates a challenge within the combined organization of how to make data-driven decisions when visibility about what data exists and where to find it is disjointed. Further, business users have difficulty finding their reports as the systems integrate over time. And when the reports aren’t easily discoverable, new ones (duplicates) are often created – taxing the BI teams with redundant work and creating more reporting chaos.