ZenOptics was recognized as a Sample Vendor in Gartner® Hype Cycle™ for Data and Analytics Governance, 2026 | Learn more
ZenOptics is proud to announce that it has been named a Sample Vendor in the Gartner® Hype Cycle™ for Data & Analytics Governance, 2026 for the Analytics Governance category.
We believe this recognition reflects the increasing importance of analytics governance as organizations prepare their analytics environments for enterprise AI, decision intelligence, and trusted business outcomes.
According to Gartner, analytics governance establishes the framework for managing analytic content, including metrics, hierarchies, business definitions, and reporting assets. As AI becomes embedded into enterprise workflows, consistent and governed analytics become essential for ensuring that both people and AI agents make decisions based on trusted business context.
Enterprise AI is transforming how organizations consume analytics.
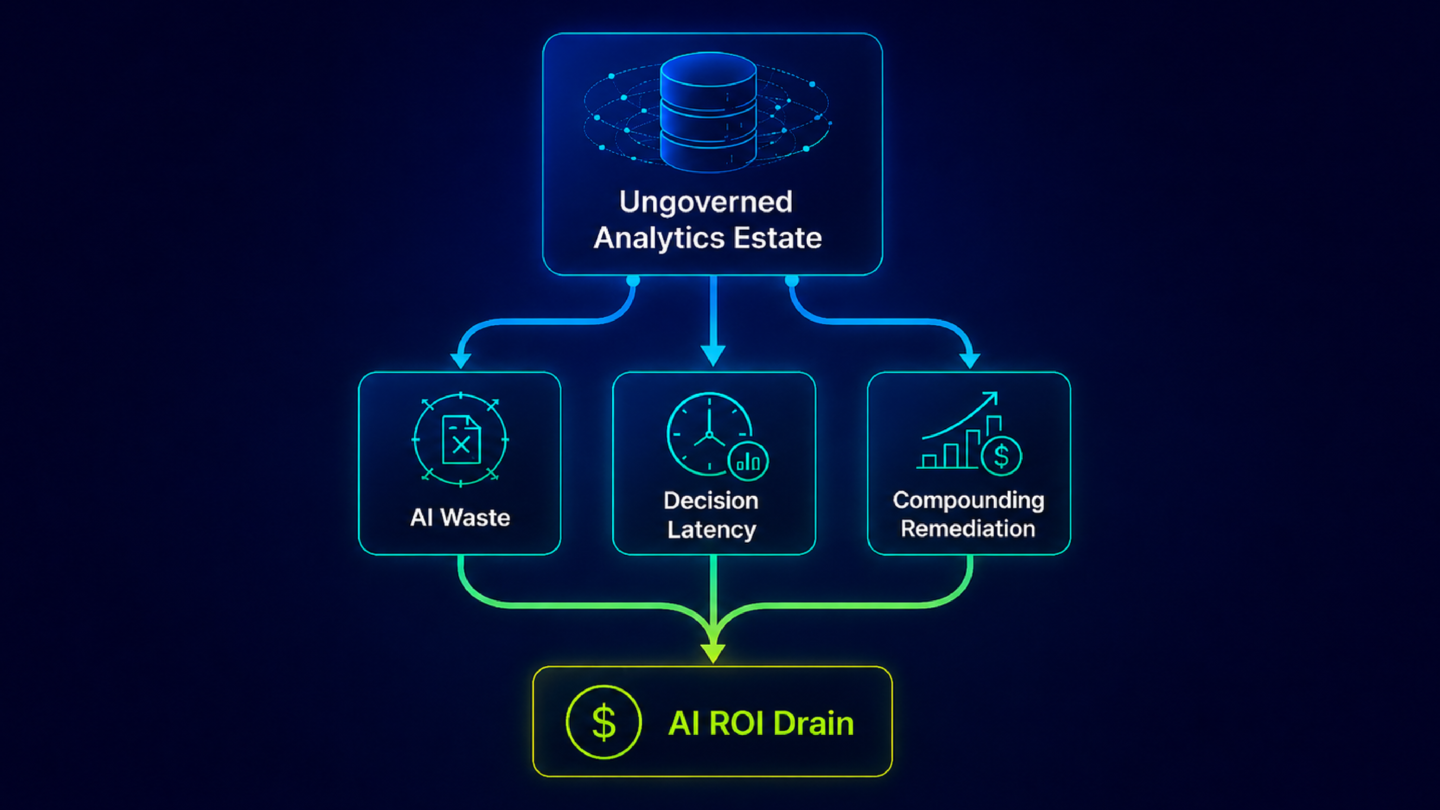
AI assistants, copilots, and autonomous agents increasingly rely on reports, dashboards, KPIs, and business definitions to answer questions and recommend actions. When these analytics assets are inconsistent or lack governance, organizations risk conflicting insights, reduced trust, and slower AI adoption.
The Gartner Hype Cycle highlights the growing importance of analytics governance in helping organizations create trusted, explainable, and consistent analytics that support enterprise-scale AI initiatives.
At ZenOptics, we believe trusted AI begins with trusted analytics.
Organizations need more than governed data. They need governed analytics that provide consistent metrics, certified reports, business ownership, and contextual relationships across the enterprise.
The ZenOptics platform helps organizations build an AI-ready analytics estate through three integrated capabilities:
Atlas provides a governed inventory of reports, dashboards, KPIs, and analytics assets across multiple BI platforms, helping organizations improve discovery, certification, and analytics governance.
Nexus transforms governed analytics into AI-ready business context by connecting certified metrics, business definitions, ownership, relationships, and lineage that AI systems can understand.
Maestro enables organizations to operationalize trusted analytics through governed decision workflows, decision provenance, and accountability, helping both business users and AI agents make explainable decisions.
Together, Atlas, Nexus, and Maestro help enterprises establish a trusted analytics foundation that supports both human decision-makers and AI-driven business processes.
As enterprises continue investing in AI, analytics governance is evolving from a reporting discipline into a strategic capability for enabling trusted enterprise decisions.
We are honored to be recognized as a Sample Vendor in the Gartner® Hype Cycle™ for Data & Analytics Governance, 2026 and remain committed to helping organizations build AI-ready analytics environments through trusted governance, business context, and decision intelligence.
ZenOptics is the Decision Intelligence Platform that helps enterprises build AI-ready analytics environments. Through Atlas, Nexus, and Maestro, ZenOptics enables organizations to discover, govern, contextualize, and operationalize analytics across complex data ecosystems, empowering both business users and AI systems with trusted insights.
Learn more at www.zenoptics.com
GARTNER is a registered trademark and service mark, and HYPE CYCLE is a registered trademark of Gartner, Inc. and/or its affiliates in the U.S. and internationally and are used herein with permission. All rights reserved.
Gartner does not endorse any vendor, product or service depicted in its research publications and does not advise technology users to select only those vendors with the highest ratings or other designation. Gartner research publications consist of the opinions of Gartner’s research organization and should not be construed as statements of fact. Gartner disclaims all warranties, expressed or implied, with respect to this research, including any warranties of merchantability or fitness for a particular purpose.
San Jose, California – June 2026 – ZenOptics, the Decision Intelligence Platform for modern enterprises, today announced its inclusion in CRN’s 2026 Big Data 100, where the company was recognized among The Coolest Data Analytics Companies of 2026.
Published annually by CRN, The Big Data 100 highlights technology vendors helping organizations manage, govern, analyze, and operationalize data and analytics to drive business value. The list includes many of the industry’s leading data, analytics, and AI, technology providers and serves as a guide for enterprises and solution providers evaluating innovative technologies shaping the future of enterprise decision-making.
In its recognition, CRN highlighted ZenOptics’ mission of helping organizations address business intelligence sprawl, fragmented analytics environments, and the growing need for trusted business context as enterprises accelerate AI adoption.
As organizations move beyond traditional business intelligence and begin operationalizing AI agents, copilots, and decision intelligence initiatives, they face a common challenge: AI systems often lack the business context needed to interpret metrics consistently, understand KPI relationships, and support trusted decisions.
ZenOptics addresses this challenge through its Decision Intelligence Platform, helping organizations unify analytics assets, govern enterprise metrics, establish trusted business context, and operationalize analytics-driven decision-making.
The platform is built around three integrated capabilities:
Atlas is the Analytics System of Record that catalogs, certifies, and governs reports, dashboards, KPIs, and analytics assets across the enterprise. Atlas provides a trusted foundation for analytics discovery, governance, ownership, and accountability across BI ecosystems.
Nexus is the Analytics Context Layer for AI. It transforms analytics metadata, KPI definitions, semantic meaning and business relationships, into governed business context that enables people, AI agents, and copilots to interpret data and analytics consistently.
By operationalizing analytics context, Nexus helps reduce ambiguity, improve trust, and provide AI systems with the contextual grounding needed for enterprise decision-making.
Maestro transforms business processes into governed execution. It orchestrates insights-driven workflows, embeds governance into decision processes, and provides traceability across AI-assisted and human-driven decisions.
Together, Atlas, Nexus, and Maestro help enterprises move from fragmented analytics environments toward AI-ready decision intelligence architectures.
“Organizations today don’t struggle because they lack data. They struggle because the data is consumed in analytics environments that are fragmented, in KPI definitions that are inconsistent, and business context is scattered across dashboards, reports, spreadsheets, and teams,” said Heena Sood, Co-Founder and CEO of ZenOptics.
“As enterprises move from BI to AI-driven decision-making, trusted outcomes require more than data and models. They require governed analytics, contextual understanding, and traceable decision processes. We believe Atlas, Nexus, and Maestro provide the foundation organizations need to operationalize enterprise decision intelligence.”
This recognition reflects ZenOptics’ continued focus on helping enterprises modernize fragmented analytics environments, establish trusted business context, and operationalize AI-ready decision intelligence.
The recognition also reinforces broader market trends, including growing demand for AI-ready analytics architectures, semantic business context, analytics governance, AI agents, AI copilots, decision intelligence, and trusted AI adoption.
As organizations continue modernizing analytics ecosystems and preparing for enterprise AI adoption, ZenOptics remains focused on helping customers answer three critical questions:
What analytics do we have and can we trust them? (Atlas)
How do people and AI agents interpret analytics consistently? (Nexus)
How do we ensure the right analytics drive the right decisions? (Maestro)
ZenOptics’ recognition as one of CRN’s Coolest Data Analytics Companies of 2026 can be viewed here:
CRN, a brand of The Channel Company, is a leading source of technology news, market analysis, channel insights, and industry recognition programs for solution providers, technology vendors, systems integrators, managed service providers, and channel professionals worldwide.
Learn more at www.crn.com.
ZenOptics is the Decision Intelligence Platform that helps organizations govern analytics, operationalize insights, and provide AI agents with trusted business context.
Built around Atlas, Nexus, and Maestro, ZenOptics enables organizations to create a governed analytics foundation, operationalize analytics context for AI, and transform insights into trusted, traceable business decisions.
Learn more at www.zenoptics.com.

Executive Chairman

Chief Executive Officer
San Jose, CA, USA—ZenOptics, a recognized leader in unified analytics intelligence and governance, is excited to announce the appointment of Heena Sood as Chief Executive Officer. Sood, as Co-Founder of ZenOptics, previously held the position of Chief Technology and Product Officer. She has been instrumental in delivering product innovation, advanced analytics automation, and a collaborative, AI-driven platform that empowers organizations to unlock the full value of their data and analytics resources.
Sood’s elevation to CEO marks a significant milestone in women’s leadership within the technology and analytics industry, further exemplifying ZenOptics’ commitment to diversity, vision, and global impact.
Sood succeeds Saurbh Khera, ZenOptics’ Founder and previous CEO, who was appointed to the role of Executive Chairman. Khera’s vision and dedication have shaped ZenOptics into a trusted analytics intelligence platform and created the Analytics Catalog software category. As Executive Chairman, Khera will focus on strategic initiatives, partnerships, and nurturing ZenOptics’ culture of excellence.
“Heena’s leadership and dedication to customer success will drive ZenOptics into its next phase of transformative growth,” said Saurbh Khera, Executive Chairman. “She embodies the culture of innovation and teamwork we’ve built, and her accomplishment is a testament to the importance of women’s leadership in technology. As Executive Chairman, I look forward to supporting her and accelerating our mission to empower data-driven organizations everywhere.”
“I am excited and honored to serve as the next CEO at ZenOptics and to continue working with Saurbh in his new position as Executive Chairman,” said Sood. “Guided by our culture of transparency, teamwork, and trust, we will continue enabling our customers to discover, trust, and utilize enterprise information for confident decision-making. I am excited to lead our talented team and champion innovation, diversity, and customer impact worldwide.”
ZenOptics delivers a unified platform for cataloging and managing BI, analytics, and data assets—bringing together reports, dashboards, KPIs, and underlying data into a single source of truth. As both an analytics aggregator and cataloging system, ZenOptics streamlines analytics access and discovery while enabling governance and promoting collaboration so that organizations can modernize, scale, and maximize the value of their analytics investments.
About ZenOptics
ZenOptics, recognized as a Gartner Cool Vendor, empowers organizations to maximize the value of their data and analytics assets by centralizing discovery, governance, and usage management across the data and analytics ecosystem. Founded by Heena Sood and Saurbh Khera and headquartered in San Jose, California, ZenOptics serves enterprises determined to drive trust, clarity, and ROI from analytics. Visit www.zenoptics.com for more information.
Media Contact:
Nitash Juyal
ZenOptics, Inc.
nitash@zenoptics.com
ZenOptics Earns a Spot on the Inc. 5000 Ranking for the First Time—Debuting at #2,224 Overall on the Inc. 5000, Earning a Position Among the Country’s Most Dynamic and Fastest‑Growing Private Businesses, #248 in Software, and #27 in San Jose–Sunnyvale–Santa Clara, CA
SAN JOSE, Calif., UNITED STATES, August 13, 2025 – (BUSINESS WIRE) – ZenOptics, a leading provider of analytics catalog and enterprise data & analytics marketplace solutions, proudly announces its debut on the 2025 Inc. 5000 list of America’s fastest-growing private companies. This marks the very first year ZenOptics has qualified for and achieved this recognition, entering the list at #2,224 overall on the Inc. 5000—earning a position among the country’s most dynamic and fastest‑growing private businesses—#248 in software, and #27 in the San Jose–Sunnyvale–Santa Clara metro area.
The Inc. 5000 list celebrates the most successful independent small businesses in the U.S., ranked by three-year revenue growth. ZenOptics’ inaugural appearance underscores the company’s impressive momentum, innovative platform, and commitment to helping organizations worldwide simplify enterprise analytics and maximize business value.
“This is a historic milestone for ZenOptics—it’s our first time qualifying for the Inc. 5000, and we’re honored to debut among such an accomplished group of growth leaders,” said Saurbh Khera, Executive Chairman and Co-Founder of ZenOptics. “Being ranked #248 in software is a testament to the dedication and vision of our entire team, the trust of our customers, and the ongoing collaboration with our partners. We remain laser-focused on empowering organizations to trust their data and drive confident decisions.”
ZenOptics is transforming enterprise analytics by unifying analytics content across disparate data and BI tools into a single, intuitive experience. The platform streamlines discovery and consumption, embeds governance guardrails for trusted self-service, and establishes a governance framework spanning the entire analytics lifecycle—driving confidence in data and analytics decisions.
Recent enhancements include a redesigned personalized landing page, persona-specific welcome pages, enriched report lineage for greater transparency, customizable governance frameworks with proactive alerts, and a native iOS app that extends unified analytics access anywhere.
“Being named to the 2025 Inc. 5000 list, in our first year of eligibility, is both an honor and a reflection of the value we deliver to our customers,” said Heena Sood, CEO of ZenOptics. “Enterprises are overwhelmed by fragmented data, multiple BI tools, and siloed analytics. By consolidating all analytics content into one intuitive, governed platform, we’re creating a rich, trusted metadata layer that not only accelerates decisions and ensures compliance by making insights easier to find, trust, and act on, but also positions organizations to fully harness AI. This recognition validates our mission to transform analytics from a complex challenge into a strategic advantage and a catalyst for innovation.”
The complete 2025 Inc. 5000 ranking, profiles of honorees, and category results will be published at www.inc.com/inc5000. The September issue of Inc. magazine, featuring the full list, will be available nationally from August 19, 2025.
About ZenOptics
ZenOptics, recognized as a Gartner Cool Vendor, empowers organizations to maximize the value of their data and analytics assets by centralizing discovery, governance, and usage management across the data and analytics ecosystem. Founded by Heena Sood and Saurbh Khera and headquartered in San Jose, California, ZenOptics serves enterprises determined to drive trust, clarity, and ROI from analytics. Visit www.zenoptics.com for more information.
About Inc. and the Inc. 5000
The Inc. 5000 list ranks the fastest-growing private U.S. companies based on percentage revenue growth from 2021 to 2024. To qualify, companies must be U.S.-based, independently owned, for-profit, and operating as of December 31, 2024. Complete details will be available at www.inc.com/inc5000.
Media Contact:
Nitash Juyal
ZenOptics, Inc.
nitash@zenoptics.com
New UX/UI improvements simplify and streamline the discovery and access of information as well as the monitoring and management of content across the data and analytics ecosystem
Gartner IT Symposium/Xpo, Orlando, Florida and San Jose, California. October 21, 2024 – ZenOptics, a leading provider of analytics catalog and enterprise data & analytics marketplace solutions, today announced major platform enhancements to its user experience (UX) and user interface (UI) at the Gartner IT Symposium/Xpo 2024. These improvements are designed to simplify and streamline the discovery and access of information, as well as enhance the monitoring and management of reports, dashboards, spreadsheets, and KPIs across the entire data and analytics ecosystem.
These enhancements will improve productivity and satisfaction for both business end users and Data & BI Teams/stewards who promote, monitor, and manage the data and analytics assets in their organization. This emphasis on intuitive, simple interactions when both engaging with and managing assets will ultimately enable organizations to derive greater value from their data and analytics investments.
“At ZenOptics, we’re committed to continually improving our platform to meet the evolving needs of our users,” said Saurbh Khera, CEO of ZenOptics. “These latest UX/UI enhancements represent a major step forward in increasing adoption and making the output of powerful analytics tools more intuitive and efficient for users and BI/Analytics teams at all levels of an organization.”
Key product enhancements include:
1. Redesigned Landing Page streamlines access to information. The ZenOptics Analytics Hub main landing dashboard is designed with visual simplicity and navigation cues through icons and branded colors so business users can more quickly and efficiently discover and access reports, dashboards, and key performance indicators.
2. A customized Welcome Page promotes important and relevant information. Curated welcome pages can be created to quickly drive consumption of relevant content for specific business users, groups or departments.
3. Expansion of information, context, and lineage for reports. Enhanced report lineage provides data source knowledge and history for citizen developers and analysts who look for more details about the data elements in the reports to validate, promote, and manage the analytics lifecycle. This new visual framework promotes emphasis of the report while bringing additional information, such as descriptions, tags for classification and enhanced search, owner, certification type and levels, and other key attributes, alongside for contextual support or further analysis.
4. Enriched Report Governance provides greater customization and flexibility. Functional advances with ZenOptics Analytics Governance establish a more flexible framework and model – including definitions of governance types, levels of granularity for certification owners, and customizable certification standards – for customers to strengthen and support their governance processes. Additionally, Report notifications support the management of the environment by creating a method of early reporting of issues.
5. Introduction of ZenOptics Mobile application. ZenOptics is launching an iOS native Mobile app, to extend the unified view of analytics and simplify access to reports/dashboards beyond the web browser.
“These platform enhancements are designed to deliver immediate impact by optimizing how users engage with their data,” said Heena Sood, ZenOptics CTO. “With intuitive design, we’ve simplified access to critical insights, enabling faster, more informed decision-making. The value lies not only in the personalized, seamless experience but also in the enriched governance and contextual reporting that drive greater data confidence and accountability. As we continue to evolve our platform, leveraging AI and value-driven design, these enhancements reflect our commitment to optimizing the data and analytics operating model.”
The new features are available to all ZenOptics customers. For more information about ZenOptics and its Analytics Hub platform, visit www.zenoptics.com.
CONTACT
Julie Arnold
Sr. Product Marketing Manager, ZenOptics
414-403-3572
juliel@zenoptics.com
About the Gartner IT Symposium/Xpo
CIOs and IT executives will learn how to meet the moment and provide the vision and results needed to lift their organizations to the next level at Gartner IT Symposium/Xpo. Follow news and updates from the conferences on Twitter using #GartnerSYM.
About ZenOptics
ZenOptics, the publisher of the ZenOptics Analytics Hub, helps organizations drive increased value from their data and analytics assets by improving the ability to discover information, trust it, and ultimately use it for improving decision confidence. Through our integrated platform, organizations can provide business users with a centralized portal to streamline the searchability, access, and use of analytics from across the entire ecosystem of tools and applications. Further, comprehensive visibility of the analytics ecosystem allows data and analytics teams to monitor, manage, govern, and optimize analytics resources while reducing the risks and costs inherent in most programs.
Projective Group and ZenOptics Announce Strategic Partnership to Enhance Data and Analytics Solutions for Clients
Joint customers will experience innovative solutions and enhanced delivery satisfaction through specialized professional services.
London, England and San Jose, California – 5th September 2024 – Projective Group, a leading financial services consulting firm, and ZenOptics, a centralized information asset management platform provider, announce the formation of a strategic partnership. This collaboration is set to deliver enhanced value to both organizations and their customers, focusing on optimizing data-driven decision-making processes and expanding service reach across new regions.
Projective Group has identified a growing need for innovative data and analytics solutions among its clients, many of whom are seeking more efficient ways to access and manage their data and analytics assets. ZenOptics offers a unique platform that addresses these challenges, making the partnership a valuable opportunity for Projective Group to support its customers even more effectively. By integrating the ZenOptics platform alongside other aspects of data programs such as data and analytics governance, they will help maximize its value and enhance their competitive data services.
“As organizations deal with increasing volumes of data, it is more critical than ever to have a simple, unified solution to support analysis and decision-making,” said Toby Pearson, Managing Partner at Projective Group. “That is why we are thrilled to partner with ZenOptics, whose innovative platform will help us not only to address our clients’ data challenges but help position them to save costs, drive efficiency, and improve trust in data and analytics for decision-making.”
For ZenOptics, this collaboration represents an opportunity to leverage Projective Group’s consulting expertise and industry knowledge to better support, advise, and serve its customers. It will enable ZenOptics to expand its geographical footprint across Europe’s key business hubs, offering its world-class solution to a broader range of clients.
“Projective Group’s domain expertise in data and governance, coupled with our market-leading analytics technology, will ensure that organizations have a comprehensive offering for data and analytics modernization transformation,” said Saurbh Khera, CEO of ZenOptics. “With this joint offering, business users can now have trusted data and analytics at their fingertips, driving competitive advantage through data-first decision-making.”
The partnership between Projective Group and ZenOptics marks a key milestone in both organizations’ growth strategies, promising to enhance offerings, expand reach, and ultimately deliver a superior service to their clients.
For more information, please contact:
About Projective Group
Established in 2006, Projective Group is an end-to-end partner for organizations who want to excel in an ever-changing environment. As a dedicated change agent for the financial services industry, they provide seamless consulting services leveraging business, technology, and delivery expertise to drive envisaged benefits and results. Their suite of specialized solutions focuses on the industry themes of data, transformation, payments, talent, and risk and compliance. With a team of over 1,200 experts, they serve their clients from Europe’s leading financial centers, including Brussels, Amsterdam, London, Frankfurt, and Paris.
About ZenOptics
ZenOptics, the publisher of the ZenOptics Analytics Hub, helps organizations drive increased value from their data and analytics assets by improving the ability to discover information, trust it, and ultimately use it for improving decision confidence. Through our integrated platform, organizations can provide business users with a centralized portal to streamline the searchability, access, and use of analytics from across the entire ecosystem of tools and applications. Further, comprehensive visibility of the analytics ecosystem allows data and analytics teams to monitor, manage, govern, and optimize analytics resources while reducing the risks and costs inherent in most programs.
This article was originally published as part of the Forbes Business Council.
I recently found my way out of an escape room for the first time and underestimated how powerful an experience it would be. If you’re not familiar, an escape room is an interactive event where you pay to be locked in a room. To escape, you must solve a series of puzzles and challenges within an allotted time. These rooms have gained popularity in recent years, with over 2,000 in the U.S. alone, and it’s easy to see why. The experience forces you to think in new ways, be creative and work as a team to quickly get a result: a key to unlock the room.
As my team solved the final clue, it dawned on me that many companies spend their entire day in an “enterprise escape room,” searching for information (making sense of reports), wasting precious time going down the wrong path (accessing inaccurate, incomplete or outdated data), and suffering from a lack of coordination. Not only is this frustrating, but also it’s morale-busting for teams across the enterprise. Instead of using the power of analytics to boost business impact, employees often stop using business intelligence platforms and analytics tools altogether. In fact, 97% of data leaders report that ignoring data has had significant consequences for their business—from missed revenue opportunities and bad investments to subpar performance forecasting.
However, spending on data and analytics solutions is expected to reach $274 billion this year as enterprises seek ways to make better, faster decisions. This investment, coupled with a chaotic reporting environment, is like being trapped without an escape in sight—you have the best minds in the room and all the tools at your disposal, but your teams just can’t break through the complexity to drive results.
The good news is that it doesn’t have to be this way. By applying the same strategies used in an escape room to the consumption of analytics, enterprises can find a logical way to reduce report clutter and turn complexity into collaboration.
If you can’t find a simple answer in an escape room, it’s likely because all of the information you need hasn’t been revealed. With the average employee spending 3.6 hours per day searching for information, employees can struggle to find what they need to move forward. You can help your employees quickly discover various reports, dashboards, spreadsheets and PDFs to expedite productivity by consolidating information and simplifying access to insights.
One way to do this is with an analytics catalog. (Full disclosure: My company has created an analytics catalog, but there are a number of other options on the market.) An analytics catalog helps enterprises simplify how tools and assets are accessed and used. This approach simplifies the user interface, giving more employees the analytics access they need.
When implementing an analytics catalog, I recommend starting small by focusing on a specific team or function. Understand the tools and reports they use most frequently and optimize that experience. Just by going through this exercise, you’ll learn who needs access and how they use the tools and assets.
An alternative to having an analytics catalog is taking a systematic, centralized approach to how all analytics assets are stored, tagged with relevant metadata, shared and accessed. This is often referred to as a data inventory or data map. Taking this approach allows a company to establish oversight authority, define the categorization, catalog the assets, run quality checks and manage access. One of the main objectives is removing duplicate or outdated assets and making it quick and simple for employees to find what they’re looking for. This requires clear ownership of the various assets, governance and a consistent approach to how assets are organized. To fully use the BI tools, you need tight integration and a seamless user experience. While this manual approach takes the right resources and focus, it can be done.
When you enter an escape room, it seems like everything is a clue. The trick is to divide and conquer by assigning each team member a section so they can analyze what’s in front of them and share details as they arise. This approach applies to enterprises as well, and when you streamline your analytics consumption, you can empower employees to share assets across teams easily. By zeroing in on a valuable source of truth, users from marketing and sales to product development and beyond can easily find relevant reports to simplify analytics work and decision making.
To escape, you need to think ahead to plan your next move wisely. The same is true at the enterprise level, so make sure you arm your employees with the right insights to empower them to quickly and confidently make decisions that can significantly impact operations. When you house all of your BI and analytics assets in one place, employees gain visibility across the entire ecosystem. The result? The ability to personalize an experience that is not constrained by the tool generating reports but rather in the context of work that needs to be done.
Communication is crucial for moving forward, and collaboration between players makes an escape obtainable. Encourage your team members to share information, focus on what’s preventing you from moving forward, and call out flags or newly discovered insights. This is invaluable for both succeeding in escape rooms and propelling business outcomes.
At the end of the day, agile businesses enable their employees to focus on problem solving, using their skillsets and accomplishing tasks. To gain a competitive advantage and foster a positive employee experience, it’s time for businesses to break free from cumbersome reporting processes in favor of efficiency, consistency and transparency. And while the odds of solving an escape room are only around 41%, overcoming analytics complexity is a sure-fire solution.
Read the article on Forbes.com
This article originally appeared on Forbes.com as part of the Forbes Business Council.
Have you ever stopped to think about how much time your organization spends on reporting? Financials, sales, marketing—you name it, we report it. This isn’t to suggest that these reports aren’t critical in running a successful business; they most certainly are.
But it’s become unwieldy for many companies with massive amounts of data, dozens of tools and reporting applications, even spreadsheets—and with so many parts of the organization accessing reports. This is the challenge my team and I face with our clients every day and why we’ve introduced an analytics catalog to bring analytics to the masses.
When it comes down to it, many individuals or teams need regular access to a specific set of reports and insights, not every report the company produces. So, by simply removing the unnecessary reports, you can significantly reduce the amount of time spent searching for and verifying analytics assets.
That’s a simple example, but the challenges are much more profound—rooted in decades of the status quo with little innovation or cultural change in reporting. As businesses embrace a self-service model for employees, the key is to make it quick and straightforward to access the data and insights needed to perform their job. Many businesses have turned to using analytics catalogs to organize their data.
Here are some of the benefits of using an analytics catalog:
1. Speed: Businesses need to move faster, and having employees spend time searching for reports is a waste. Employees will often resort to (re)creating reports they need because it’s too difficult to find what they need. In 2020, teams spent 13% of their time on work that’s already been completed, up from 10% the previous year. As a result, employees are losing 236 hours to duplication of efforts a year. Having an analytics catalog can eliminate this wasted time.
2. Trust: Even when employees have access to the reports they need, there’s a lingering concern about the accuracy of the data, whether it’s the most recent report and if the numbers have been validated. Without a way of managing and verifying reports, you can’t be sure of the accuracy, which significantly impacts trust. With proper reporting and an analytics catalog, employees can be confident in their daily decisions.
3. Growth: Businesses depend on analytics, insights and accurate data to make critical business decisions. Without the ability to consistently make data-driven decisions, businesses will be challenged to grow at the pace of the industry. Business leaders are starting to realize that the ability to analyze data and extract insights significantly influences the company’s ability to grow.
Once you’ve found the right analytics catalog that meets your business needs, as the CEO of an intelligent analytics catalog company, I suggest to get to work controlling report sprawl by keeping these best practices in mind.
Decentralized data can cause an array of issues, including exposure to breaches, compliance challenges and lagging performance. Rather than limiting users, increasing usage with a single, unified view ensures that your teams are accessing the most reliable data easily and that any compliance issues, like personally identifiable information (PII), can be quickly identified. Provide regular demos and training to accelerate adoption and teamwide buy-in.
To foster agility, organize your analytics assets with tags and companywide naming conventions to increase consumability. Consider looking for a catalog that features built-in recommendations, as this can make it easy for your employees to find the most recent reports relevant to their department that have been verified for quality. Identify redundancies by relying on algorithms to flag similar or duplicate reports based on metadata.
Leverage the power of intelligence and automation to drive consumption. Take advantage of keyword search capabilities and metadata to streamline access to reports and ensure that your teams are using the tools your organization is paying for—and accessing reports that will expedite decision making.
Use the data at your fingertips to understand who is viewing each report, discover the types of reports being generated and whether they are certified, and identify any potential gaps in your analytics program to drive performance improvements. Understand how data is being used by your teams—from IT and finance to marketing, sales and beyond—to make use of what’s relevant and stop wasting time on what isn’t.
Rather than becoming yet another tool in your company’s toolbox, it’s critical to anticipate any adoption challenges and validate the inherent value of an analytics catalog across your organization. Having the right people and roles in place to maintain your analytics assets is a critical component of effective usage.
Consider developing a role (a great opportunity to upskill existing staff) to streamline both the adoption and continued use of the analytics catalog—both from a technical and business point of view. Along with regular management of the platform, this analytics-focused role can be responsible for bridging the gap between business outcomes and increasing consumption across all business units.
An analytics catalog is a business-friendly way to increase access to reports and drive performance. By getting report sprawl under control, businesses across all industries can be poised to move faster, build greater trust and grow exponentially. Along with increased visibility, reduced noise and complexity, and streamlined access, analytics catalogs bring context and cohesion to disparate tools and resources.
With a catalog, analytics consumers can gain access to cross-platform assets with inherited security permissions and the assurance that the assets are governed and organized to flow through prescribed paths for usability. And, that’s reporting done right.
See the full article.
Eliminates time wasted searching for reports with intuitive employee experience
SAN JOSE, Calif., April 05, 2022 (GLOBE NEWSWIRE) — ZenOptics, the analytics catalog industry pioneer, gives employees a personalized experience to simplify the discovery of analytics assets used across the enterprise. ZenOptics has seen rapid growth fuelled by businesses needing to utilize analytics investments as a competitive advantage.
Analytics consumers, anyone within an enterprise that needs access to an analytics asset such as a report, dashboard, key performance indicator (KPI), and even spreadsheets, word processing, and presentation documents, are often overwhelmed by the volume and diversity of analytics tools and assets. When employees access an asset, there is little confidence in ungoverned insights and if the information is correct and up to date.
These challenges present significant barriers causing analytics investments to underperform and go underutilized. In fact, just over 14% of employees use the Business Intelligence (BI) software the organization has invested in [BARC, 2022], creating financial pressures, poor reporting, and a challenging work environment. The average company uses more than 360 applications, and unless the employee experience is simplified, these issues will only worsen over time.
“Every part of an organization uses multiple tools and apps to collect and analyze important data, so this isn’t isolated to the finance or sales teams, said Saurbh Khera, Founder, and CEO, ZenOptics. “By using advanced integration and machine learning (ML) technologies, we’ve addressed these challenges by simplifying what is critical to this new analytics consumer, reducing the clutter they typically sort through. By presenting reports and dashboards in a consumable employee experience, report users significantly reduce the time spent searching for these assets.”
Businesses need more of their workers to use more of the analytics investments if they want to move quickly and adapt to changing conditions. ZenOptics helps organizations address several emerging challenges:
Drain on resources: Teams are constantly wrestling with tool complexity and access across most organizations, causing a severe drain on time and resources. The average knowledge worker spends about 2.5 hours per day, or roughly 30 percent of the workday, searching for information [IDC]. ZenOptics provides each employee with a personalized view of the assets they use most frequently.
Inaccurate reporting: 44% of users occasionally or frequently made a wrong decision because they did not have the information they needed. In addition, 43% of users reported occasionally or frequently overlooking important information because of too many applications or the volume of information [Gartner]. ZenOptics ensures that analytics assets are verified and accurate.
Lack of speed and agility: Every business function today needs access to analytics assets, so a centralized model doesn’t work. In that environment, for teams requesting access to internal data beyond their departmental remit, the response time could be measured in months in 53% of cases [McKinsey]. ZenOptics puts the right assets in the hands of the analytics consumer.
Distributed operations: Businesses are embracing a growing remote workforce and have highly distributed operations – geographically, location-operations centers, warehouses, stores and client locations. ZenOptics ensures the analytics consumer has the right level of access depending on their role, location, responsibilities and other factors.
These challenges are fuelling ZenOptics’ continued growth and momentum. The company grew 150% year-over-year in 2021 and nearly doubled the number of customers which include Brown-Forman, Janney Montgomery Scott, and Benjamin Moore.
ZenOptics has also been growing globally, with a 300 percent increase in customers across Europe. To better support this growth, ZenOptics recently announced the opening of a new European office in London.
“ZenOptics fills a major gap in the current analytics landscape as companies grapple with shifting from producing more and more to making better use of what they already have,” said Donald Farmer, Principal, TreeHive Strategy. “With ZenOptics, organizations can maximize the value of their analytics investments by increasing usage and improving consumability for a broader population of analytics consumers.”
ZenOptics, recognized in Gartner’s Cool Vendors in Analytics, enables analytics producers and consumers to align around the business objective to better assess, optimize and scale the impact of analytics across the organization. By providing employees with a high-quality experience, they’re at least 1.5 times more likely to have high levels of work effectiveness, productivity, discretionary effort, and intent to stay at their current employer [Gartner].
In addition to providing a better employee experience, ZenOptics analytics workspace empowers leaders to compose and share analytic flows using fit-for-purpose tools, interlocked with policies for governance, quality, and compliance to better integrate into the business context.
ZenOptics helps organizations maximize the value of their analytics investments by increasing usage and improving consumability for a broader population of analytics consumers. ZenOptics’ analytics catalog provides a personalized experience to simplify the discovery of analytics assets generated within the entire ecosystem of tools and applications already in use at organizations today. An intuitive analytics workspace empowers consumers to compose and share analytics flows using fit-for-purpose tools interlocked with policies for governance, quality, and compliance to better integrate into the business context. Personalized dashboards enable analytics producers and consumers to mine intelligence from connections between teams and assets to align analytics work with business objectives and better assess, optimize, and scale the impact of analytics.
ZenOptics was recognized in Gartner’s Cool Vendors in Analytics.