


In the on-premise era, hoarding data was cheap. In the cloud era, it is a liability.
Every time you migrate a Tableau workbook or a Power BI report to the cloud, the meter starts running. You pay for storage, for compute power during refresh cycles, and for backup instances. Yet, a massive portion of this spend is wasted. According to ZenOptics enterprise analysis across Fortune 500 deployments, 38% of reports are never viewed, and 32% are duplicates.
These are "Zombie Reports" (officially classified as stale reports in your ecosystem). They haven't been opened in over six months, yet they continue to consume licenses, engineer hours, and infrastructure budget. This bloat inflates your Total Cost of Ownership (TCO), and for a typical enterprise, it is costing nearly half a million dollars a year.
→ Related: Tableau Sprawl Is Costing You Twice: Why Dashboard Chaos Kills Both Trust and Cloud Budgets
The Math: Where the 40% Waste Hides
You might think, 'Storage is cheap, so why does it matter?' But the Total Cost of Ownership (TCO) of a report is far more than just disk space.
Based on a typical enterprise model with 10,000 reports and 800 active licenses, the annual "maintenance bill" for the bi dashboards estate is approximately $1.07 million.
Here is where the waste hides:
Compute Costs (~$52k/month): Every zombie report that is scheduled to auto-refresh is burning CPU cycles you pay for.
Licensing Leakage (~$15k/month): You are often paying for expensive 'Creator' or 'Explorer' licenses for users who only consume static content or, worse, haven't logged in for months.
Maintenance & Support (~$22.5k/month): Your data engineers spend hours troubleshooting failures on reports that nobody reads.
This aligns with Everest Group's 2024 research, which found that 67% of organizations experienced higher-than-expected cloud costs, with 82% of global organizations reporting that at least 10% of their cloud spend is wasted.
When your users cannot find what they need, they create duplicates, compounding the trust gap and driving more wasted spend.
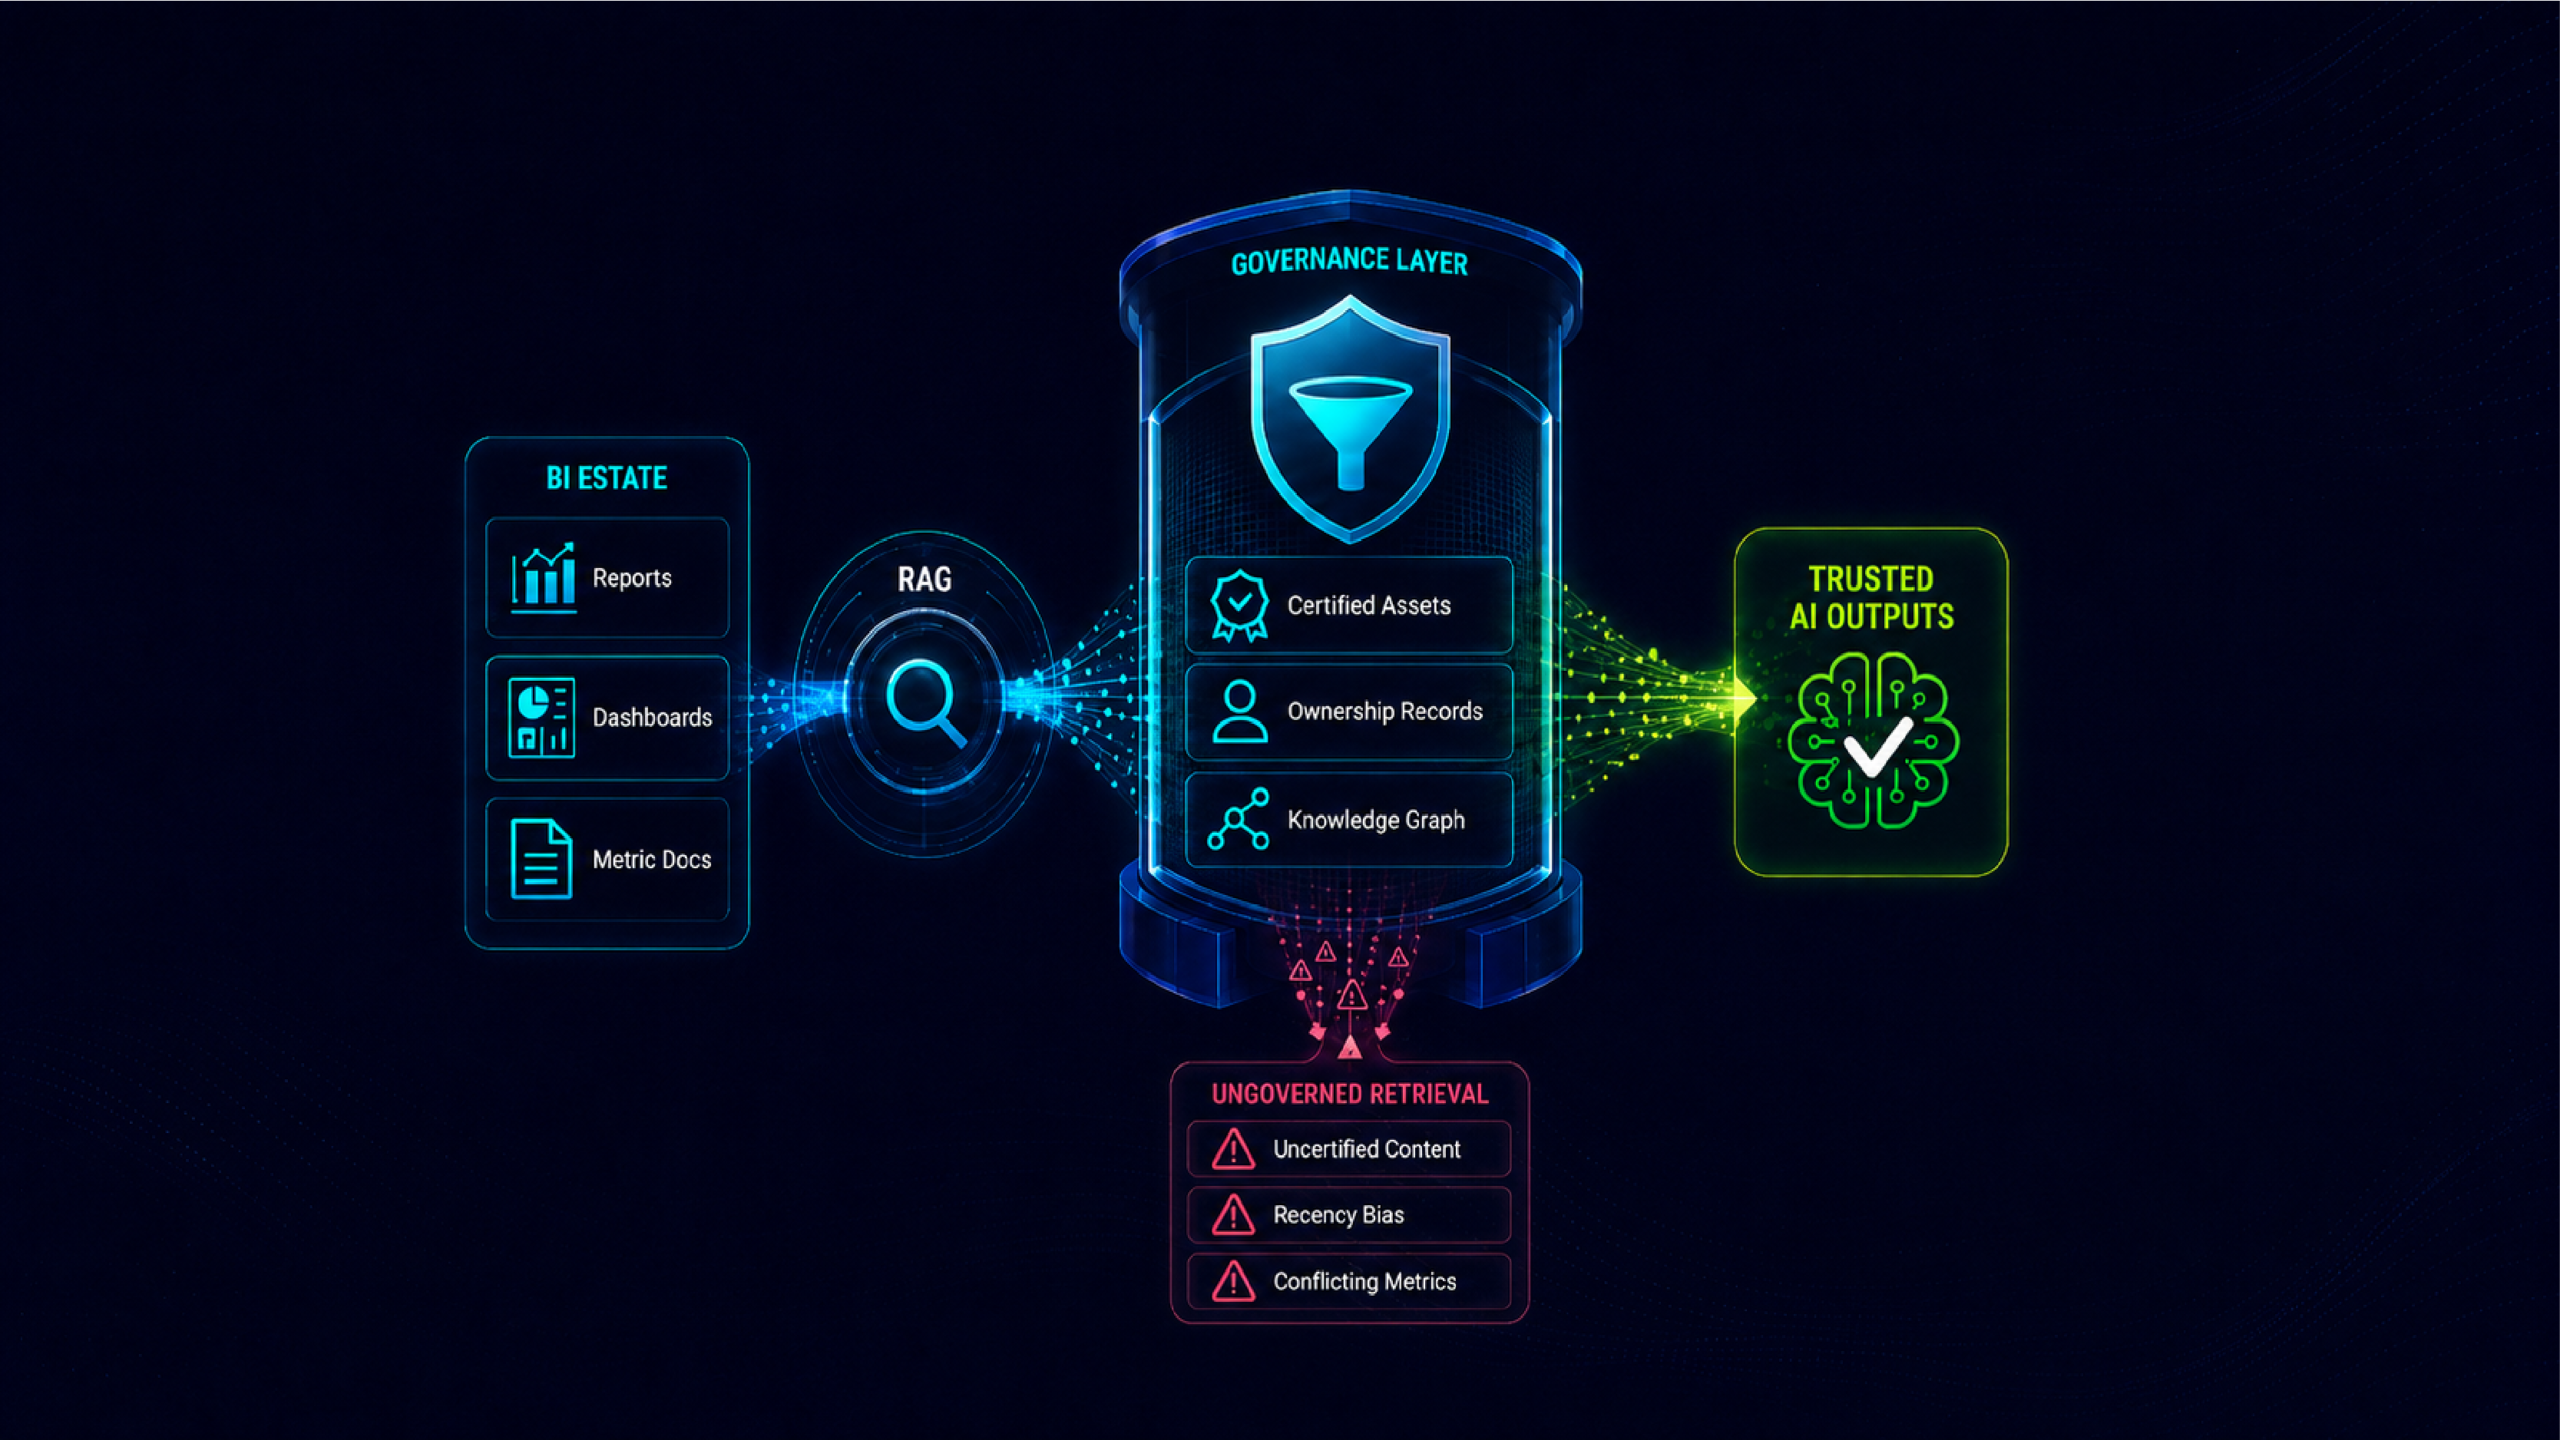
Rationalization via BI Ops
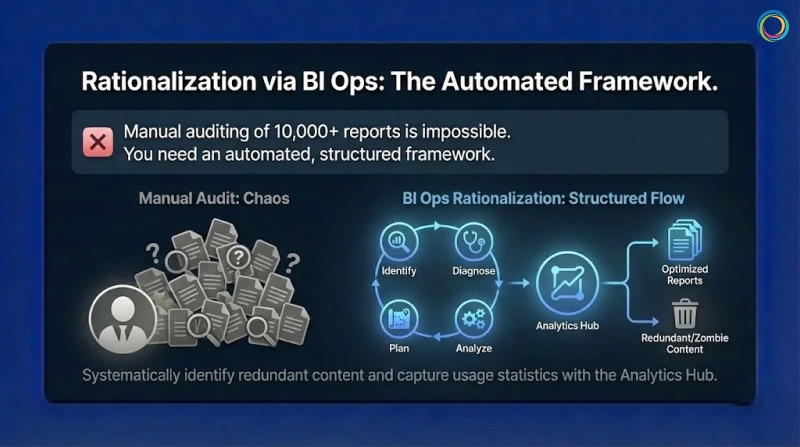
You cannot manually audit 10,000 reports to find the zombie reports. You need an automated, structured framework. This is the Analytics Ops (or BI Ops) methodology.
To reclaim your budget, follow the Identify > Diagnose > Analyze > Plan cycle:
1. Automated Diagnostics (The Audit)
Stop guessing. Deploy connectors to crawl your BI platforms (Tableau, Power BI, Qlik, etc.). This automatically builds an inventory and captures usage statistics.
What to look for: Reports with zero views in the last 180 days.
2. Identification of Stale & Duplicate Assets
Use metadata analysis to detect redundancy.
The "Kill List": Identify stale reports (zombie reports) and duplicate reports (e.g., 'Sales_v1' vs. 'Sales_Final').
Modern self service analytics environments often grow unchecked. Without automated detection, the same report gets recreated multiple times as users cannot find existing assets. This dashboard fatigue drives redundancy that inflates your BI spend.
3. Decommissioning (The Savings)
Safely retire the unused assets. This immediately reduces your cloud footprint and frees up licenses.
The Result: A cleaner environment where search actually works, and a budget that is optimized for innovation rather than maintenance.
A global Fortune 500 manufacturer faced a challenge familiar to many large enterprises: an unmanageable reporting environment with no way to evaluate relevance, freshness, or reliability across thousands of assets.
The Challenge: The organization had accumulated over 10,000 reports across their ecosystem, with no systematic way to identify which reports were critical, which were duplicates, and which were no longer relevant.
The BI Ops Approach: They implemented the ZenOptics Analytics Hub to crawl their entire BI landscape, capture usage statistics, and systematically identify redundant content.
The Results:
- 67% of reports identified as duplicate or stale, representing massive hidden maintenance cost
- 10,000+ reports rationalized to just over 4,000, a 60% reduction in footprint
- 100+ key business reports certified. Users now know exactly which reports are trusted
- 40% reduction in time spent searching for the right information
Brown-Forman, the global spirits company behind Jack Daniel's, achieved similar results with their analytics rationalization initiative:
- 30% reduction in reports by eliminating duplicates and consolidating multiple reports into single sources
- 4,000+ users unified under a single analytics access point
"ZenOptics has helped us solve our distributed reporting challenges and improve collaboration throughout our organization."
— Sam Sorsa, Senior Director of Finance, Brown-Forman
Every dollar you spend maintaining a zombie report is a dollar you cannot spend on AI or predictive analytics. With Gartner forecasting global public cloud spending to reach $723 billion by 2025, the stakes of cloud waste have never been higher.
Report Rationalization is not just a housekeeping task; it is a financial imperative. By identifying stale content and eliminating duplicates, you can slash your TCO by 40% and turn your analytics budget into an investment, not a tax.
Published January 28, 2026