Analytics AI at Enterprise Scale: Why the Value Gap Is a Context Gap

Read More

Analytics AI at Enterprise Scale: Why the Value Gap Is a Context Gap

Read More
Federal
Insurance
CPG

Turn Insurance Analytics Into Trusted Decisions and AI-Ready Execution

"Every major insurance decision — pricing risk, managing claims, setting reserves — depends on trust in the numbers. But the same KPI can mean different things to different teams. When that happens, decisions slow down and risk increases."

Unify fragmented insurance analytics. Give AI the right context. Operationalize decisions with confidence.

ZenOptics helps insurers understand their BI estate, unify trusted analytics, activate BI metadata as AI-ready context, and embed that intelligence into governed business workflows.

Insurance Analytics Dashboard

Insurance Analytics Breaks at the Definition Layer

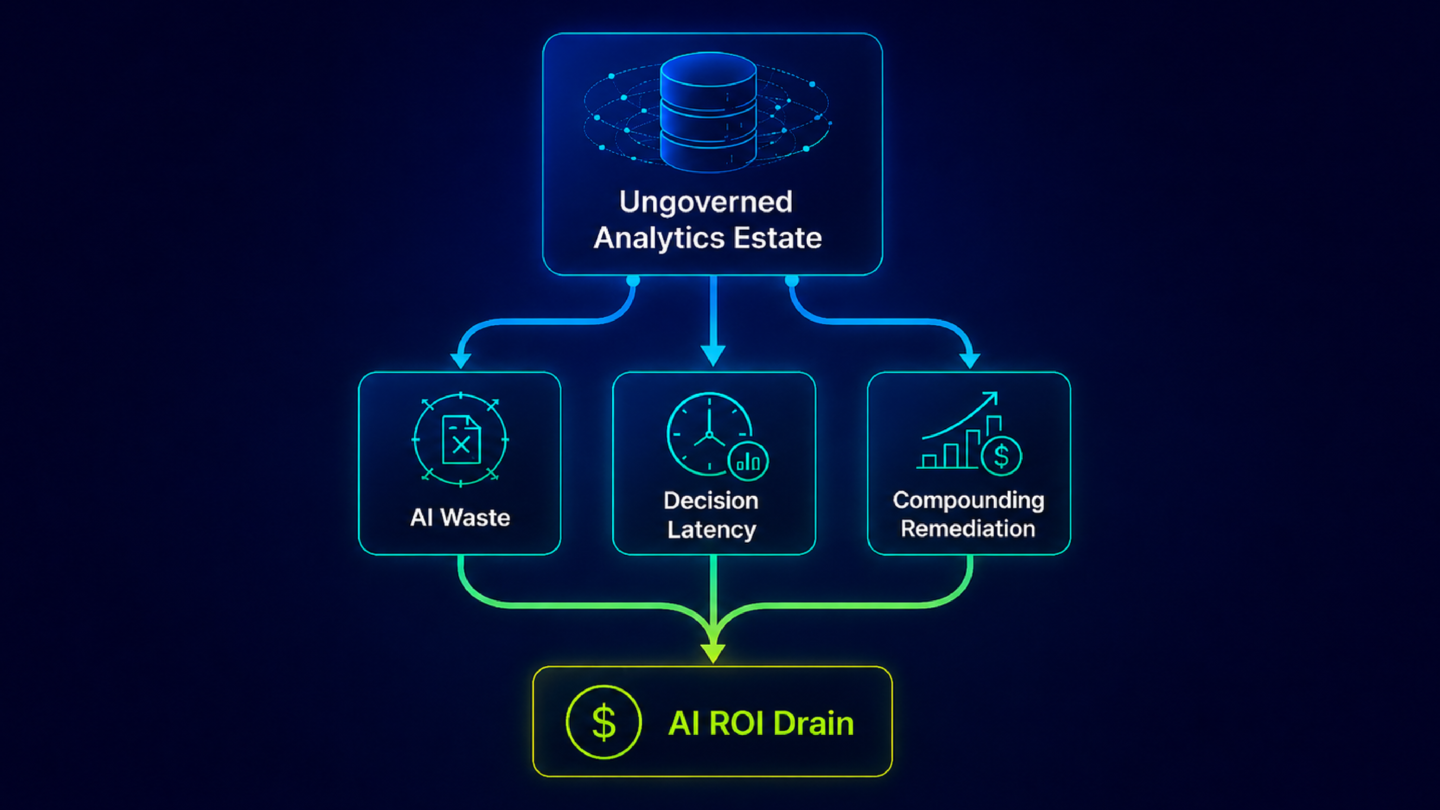
Insurance systems generate massive volumes of data. But decisions break when KPI definitions are not aligned across teams and tools.

KPI Definitions Break Across Functions

Ask three teams what "loss ratio" means and you'll get three different calculations — depending on whether underwriting, claims, or finance runs the report.

Metrics Exist, But They Don’t Agree

Claim severity, cycle time, reserve estimates — each system calculates them its own way. The numbers exist, but they don't agree.

KPI Logic Is Locked Inside Reports

KPI definitions live inside individual reports, not in a shared layer that everyone pulls from.

When Metrics Don't Align, Decisions Don't Either

Disconnected KPI definitions create systemic risk across the insurance value chain

Underwriting prices risk using profitability signals that don't match what finance reports. That's a definition problem, not a data problem.
Claims operates on one severity model. Finance uses another. Actuarial reconciles both — manually, every cycle.
By the time numbers reach the executive team, someone has already spent days validating them.
The issue is not data accuracy. The issue is inconsistent KPI context across the business.
BI Ops

Understand Your Full BI Estate Across Legacy and Modern Tools

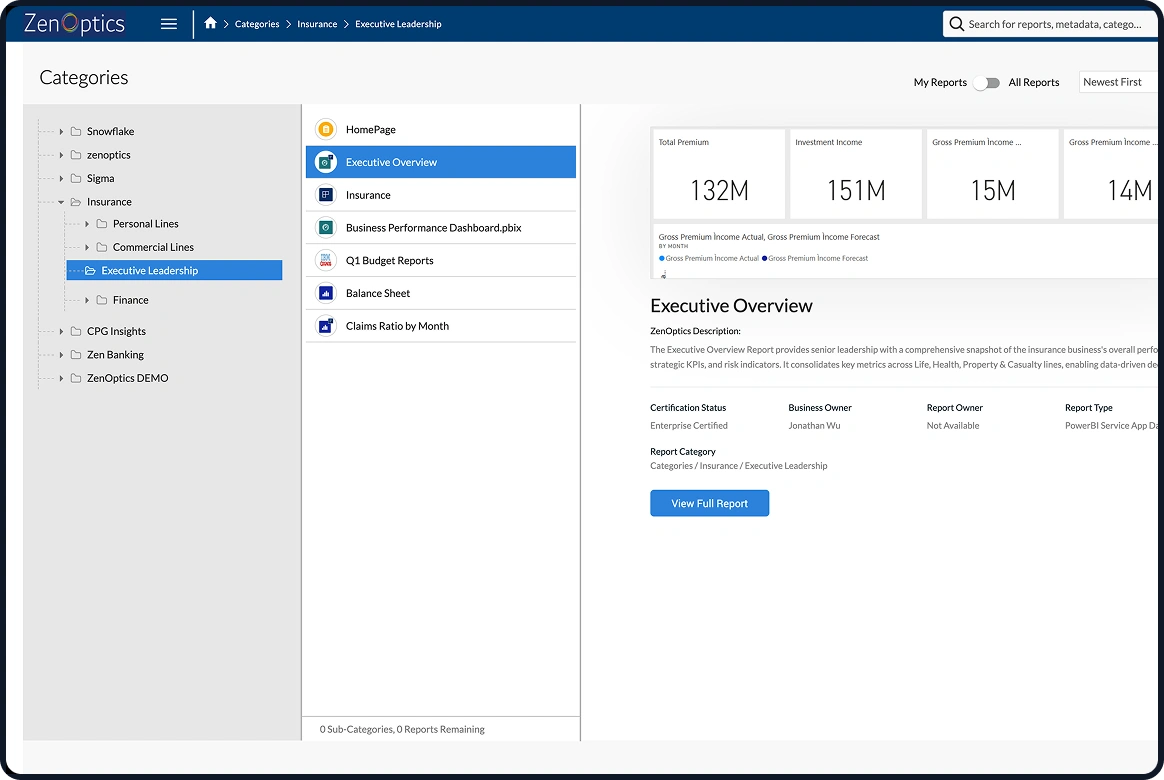
Insurance enterprises often operate across SAP BusinessObjects, Tableau, Power BI, SSRS, Cognos, and department-specific reporting layers. The claims team may rely on one loss ratio report in Tableau, while finance uses a different version from SAP BusinessObjects — each with different definitions for incurred losses or earned premium.

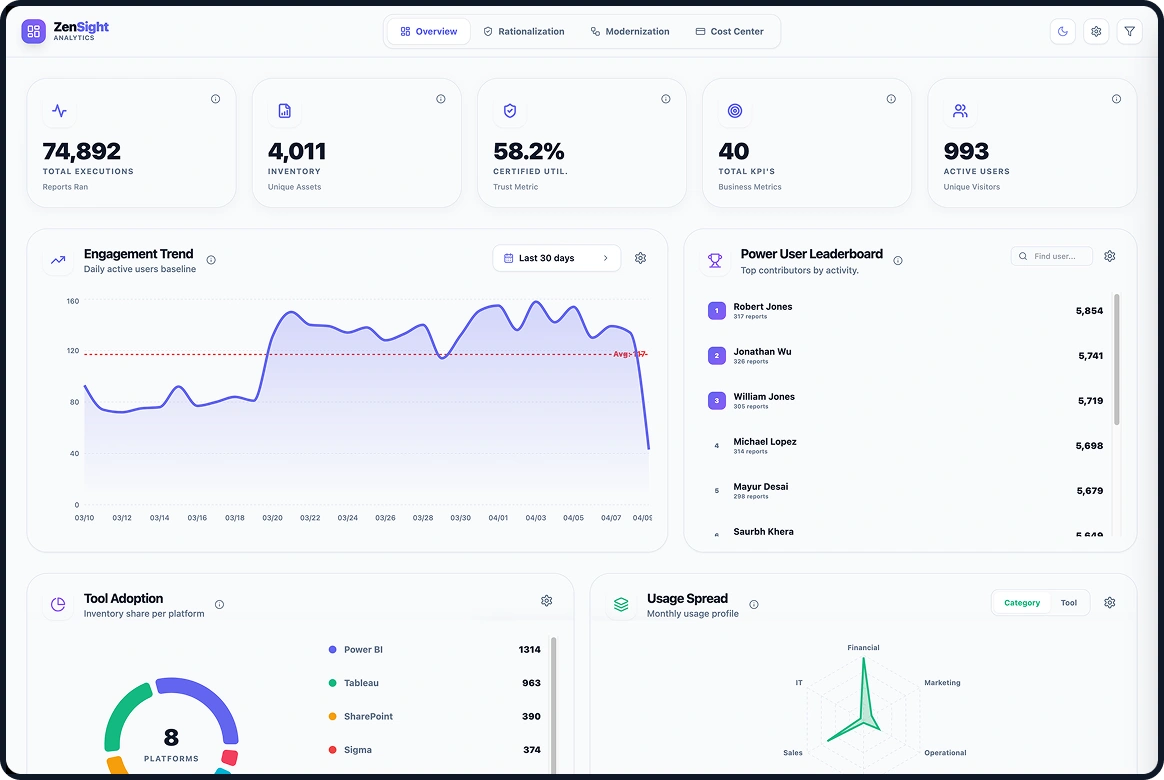
ZenOptics BI Ops gives insurers a complete operational view of their analytics footprint across all BI tools.

Practical Insurance Scenarios
What BI Ops Delivers
Identify duplicate loss ratio dashboards across finance and underwriting
Determine which claims operational reports in SSRS are still actively used
Map where reserve reports differ between actuarial and finance environments
See which legacy dashboards can be retired as teams move to modern BI
Inventory of reports, dashboards, and KPI assets across platforms
Usage analytics by team, role, and tool
Duplicate and orphaned report detection
Legacy modernization and retirement visibility
Rationalization insights for BI consolidation
BI Ops Dashboard
Atlas

Bring Trusted Reports, Dashboards, and KPIs into One Place

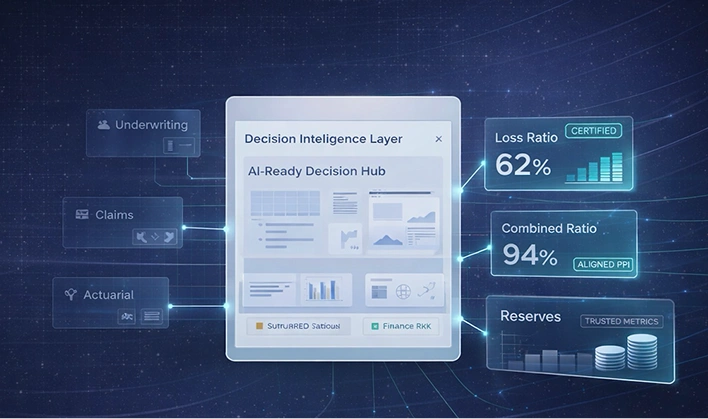
Underwriting may use one combined ratio report, while finance uses another with different expense allocations. Atlas gives each team a single certified view of the KPIs they depend on.

Practical Insurance Scenarios
What Atlas delivers
Underwriting teams find the certified portfolio profitability dashboard by line of business
Claims leaders access trusted severity, leakage, and cycle time reports in one place
Finance works from a single certified definition of combined ratio and expense ratio
Actuarial teams align on trusted reserve adequacy and loss trend analytics
Unified analytics catalog across all BI tools
Certified dashboards and KPI definitions
Ownership, stewardship, and governance workflows
Persona-based views for underwriting, claims, finance, actuarial, and operations
Faster discovery and adoption of trusted analytics
Atlas Platform
Nexus

Turn BI Metadata into an AI-Ready Context Layer

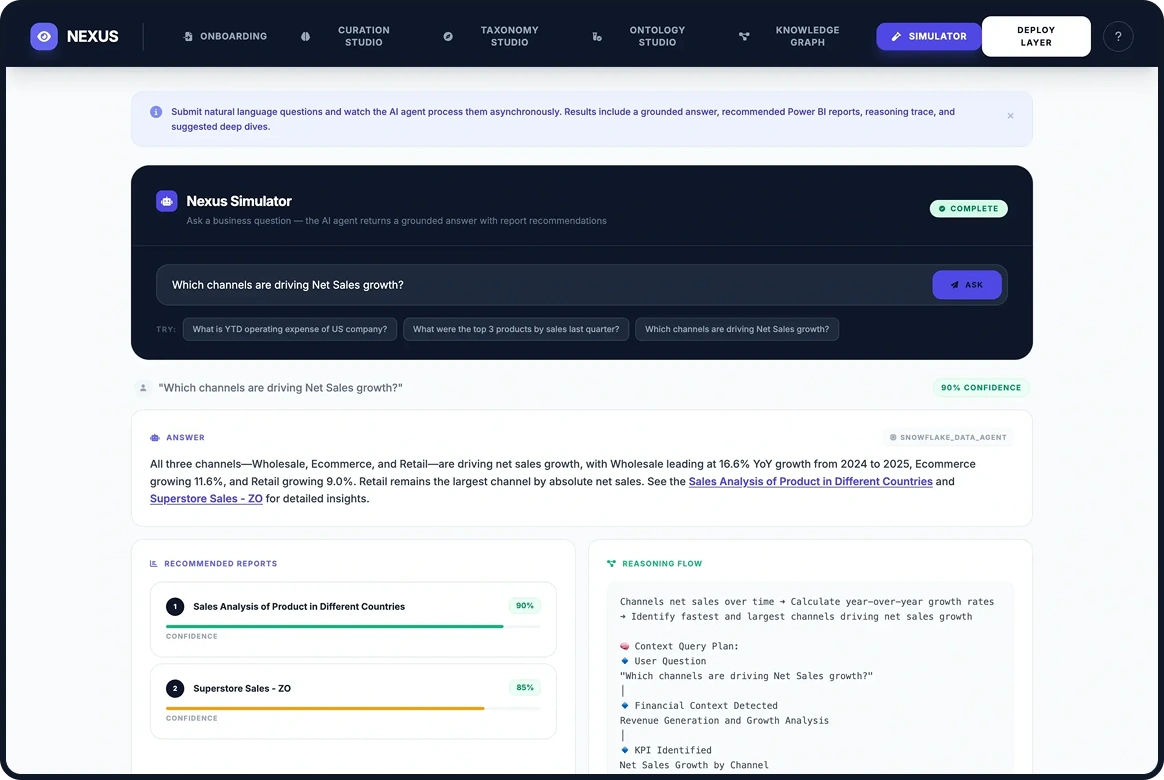
AI copilots can answer questions about claims or reserves, but without shared context they produce inconsistent results. Nexus activates the meaning in your BI metadata and turns it into an AI-ready context layer.

Practical Insurance Scenarios
What Nexus delivers
A copilot answers: "Why did loss ratio increase in commercial auto last quarter?" using the certified KPI and trusted underwriting dashboards
AI explains which factors are driving claims cycle time increases by region and claim type
Finance and actuarial teams receive consistent answers to questions about reserving trends
Operations leaders ask: "Which service KPIs are below target this month?" and get answers mapped to certified metrics
AI understanding of certified KPI definitions
Semantic relationships between metrics, reports, and hierarchies
Cross-tool business context for copilots and agents
Consistent AI answers grounded in trusted analytics
Faster AI deployment without rebuilding a semantic layer from scratch
Nexus AI Context
Maestro

Embed Analytics and AI into Governed Insurance Workflows

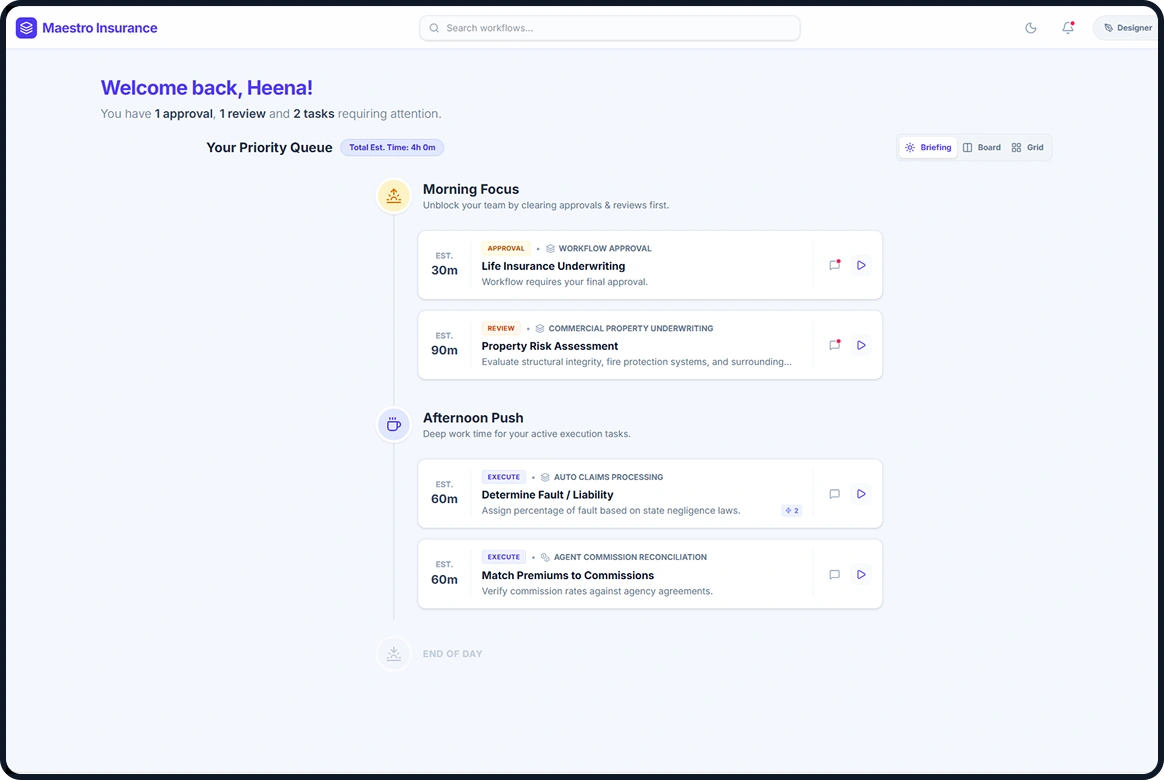
Claims triage, underwriting reviews, reserve monitoring — these decisions are often spread across emails, reports, and disconnected systems. Maestro turns trusted analytics and AI into repeatable, governed workflows.

Practical Insurance Scenarios
What Maestro delivers
Claims triage workflow: prioritize claims using certified severity and leakage analytics
Underwriting review workflow: route underperforming portfolios for review using trusted profitability metrics
Reserve monitoring workflow: flag variance trends and assign review tasks to finance and actuarial teams
Fraud escalation workflow: connect anomaly analytics to governed investigative steps
Operational service workflow: trigger action when SLA or cycle time KPIs fall below threshold
Structured workflows tied to trusted analytics
AI-assisted decision steps with guardrails
Monitoring and governance for AI-driven recommendations
Decision traceability from KPI to recommendation to action
Repeatable operational playbooks across insurance functions
Maestro Workflow

What Changes When KPI Context Is Unified

From fragmented analytics to trusted, decision-ready intelligence

Get Demo

One Definition Per KPI

Consistent KPI definitions across underwriting, claims, actuarial, and finance

Faster Decisions

Faster, more confident decision-making across the policy lifecycle

No More Reconciliation

Reduced manual reconciliation across teams and reporting cycles

Audit-Ready

Improved audit readiness with clear lineage and ownership

AI That Works

AI systems that deliver consistent, explainable outputs

CEO Perspective

“Insurance is ultimately a business of risk — and managing that risk depends on decisions you can trust. Our vision with ZenOptics is simple - To create an environment where every decision in an insurance organization — whether made by a human or an AI system — is grounded in trusted metrics, understood in a consistent context, and executed with full accountability. That’s what we believe will define the next generation of insurance leaders. Not who has the most data, but who can turn that data into aligned, explainable, and repeatable decisions at scale.”
Heena Sood
CEO, ZenOptics Inc.

Align Your KPIs Before You Scale AI in Insurance

When metrics mean the same thing everywhere, decisions become faster, clearer, and scalable