


The majority of BI initiatives fail to deliver expected impact because of poor governance and limited adoption. With most enterprises now operating multiple BI platforms simultaneously, analytics sprawl is the default state: duplicate reports, unclear ownership, inconsistent metrics, and eroding trust across the enterprise.
This article presents a 5-level analytics governance maturity model that maps each stage to the specific capabilities and tooling required to advance. Not data governance, which manages raw data quality and lineage at the source layer. Analytics governance manages the artifacts built on top of that data: reports, dashboards, KPIs, and metrics across Tableau, Power BI, Qlik, SAP, MicroStrategy, and every other tool in your environment.
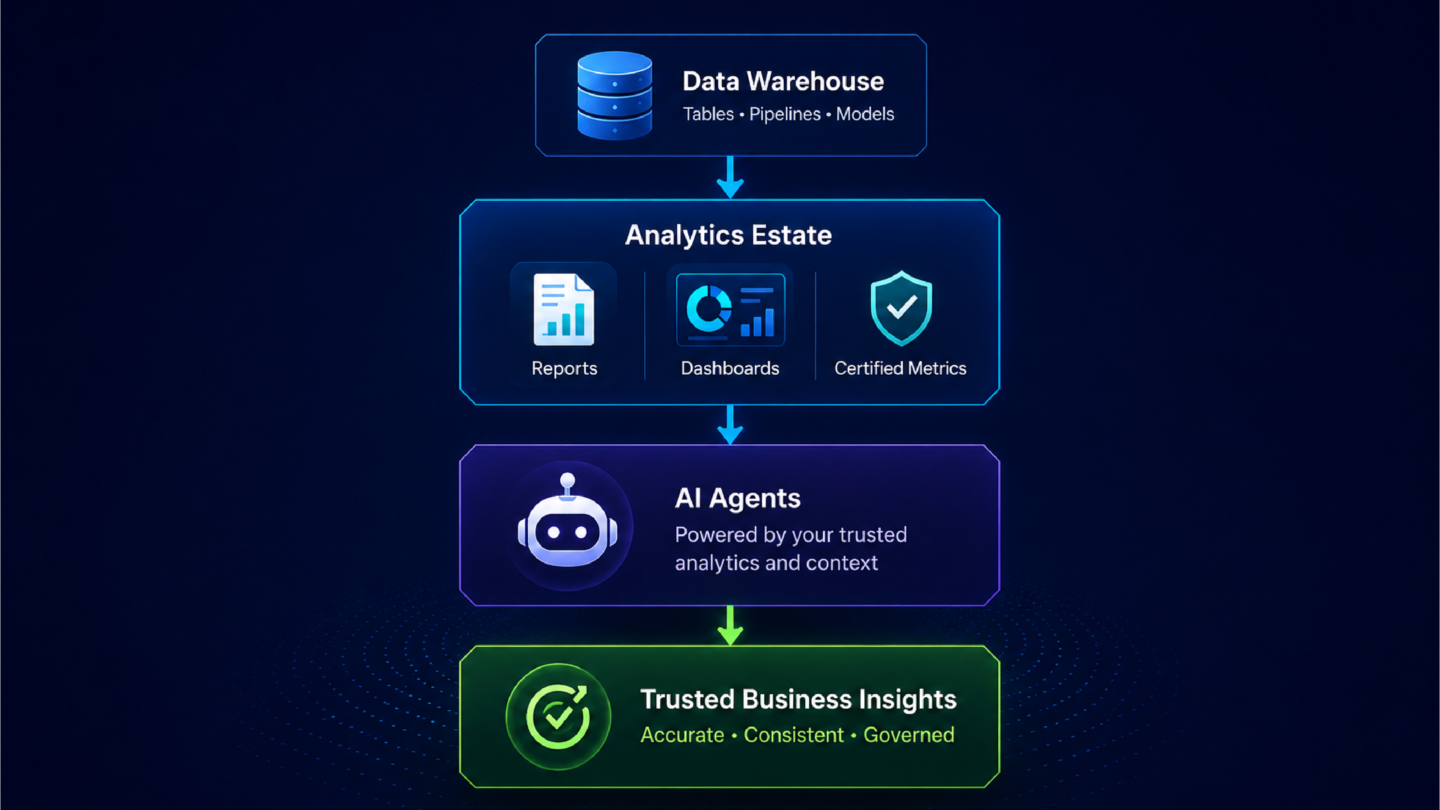
The maturity model follows a three-layer progression that mirrors how enterprise analytics infrastructure evolves: from establishing an analytics system of record, to building a semantic context layer for AI readiness, to embedding governance into operational business workflows.
Why a Maturity Framework
Most analytics governance initiatives fail because organizations treat governance as a one-time project rather than an evolving operating discipline. The pattern is consistent: a compliance event triggers a governance push, a catalog tool is deployed, initial policies are documented, and then investment stalls. Within 12 months, the catalog is full of stale metadata, governance policies go unenforced, and the organization is functionally back where it started.
The 60% BI initiative failure rate is not random. It correlates directly with organizations that lack a structured approach to governance maturity. And in environments running Tableau, Power BI, Qlik, and SAP side by side, governance complexity compounds with every tool added because each platform has its own access model, metadata schema, and certification process.
A maturity framework provides the structured alternative. It defines where you are, what each level requires, and what specific capabilities and tooling you need to advance. The model below maps platform capabilities to each level of advancement, with verified enterprise outcomes at the stages that matter most.
The Five Levels of Analytics Governance Maturity
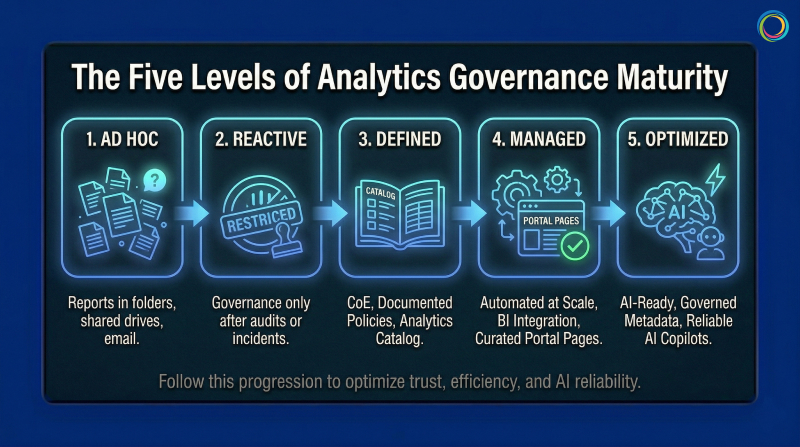
Level 1: Ad Hoc
No overarching governance structure. Reports exist in personal folders, shared drives, and email inboxes. Tool sprawl is uncontrolled, with teams adopting BI tools without IT coordination. No audit trail, no access controls, no certification process. A significant portion of reports created at this level are never consumed by anyone, meaning report-building effort produces zero business value.
Tooling required: None. The first move is governance policy: defining ownership, certification criteria, and access control standards. A governance charter and RACI matrix for analytics ownership are sufficient to begin.
Typical profile: Small to mid-market, or post-acquisition with unconsolidated governance. Advancement to Level 2: 6 to 12 months.
Level 2: Reactive
Governance begins only after a trigger: an audit finding, a security incident, a license audit revealing unexpected costs. Processes are manual and enforcement is uneven. A governance team exists but operates reactively. Duplication detection is manual, and governance is perceived as a gate rather than an enabler.
Tooling required: Still primarily policy-driven. Organizations at this level need to define governance structure before investing in technology. Spreadsheet-based tracking works temporarily but hits scaling limits quickly, signaling readiness for Level 3.
Typical profile: Mid-market in regulated verticals (insurance carriers, pharmaceutical, financial services) post-compliance event. Advancement to Level 3: 12 to 18 months.
Level 3: Defined (Establishing the Analytics System of Record)
This is the first level that requires dedicated tooling. Governance policies are formally documented. A BI Center of Excellence or Analytics CoE owns enforcement. An Analytics Catalog inventories reports and dashboards with standardized metadata: owner, update frequency, data source, certification status.
At this stage, organizations establish an analytics system of record using a combination of BI platform capabilities, spreadsheets, and internally developed portals or hubs. These approaches provide centralized visibility into reports, dashboards, and KPIs across tools and teams.
This is where most organizations stall. Catalog maintenance becomes labor-intensive when metadata entry is manual. Cross-tool governance (maintaining policies across both Tableau and Power BI) requires duplicate processes that do not scale. While visibility improves, governance remains difficult to sustain and standardize across the enterprise due to reliance on manually maintained systems. The Level 3 to Level 4 transition demands automation.
Typical profile: Large mid-market to enterprise with compliance requirements (CPG, insurance carriers, federal). Advancement to Level 4: 18 to 24 months.
Level 4: Managed (Automating Governance at Scale)
Governance is automated: Atlas integrates with all BI platforms for automatic metadata ingestion and usage tracking, eliminating the manual catalog maintenance and fragmented, homegrown governance processes typical of Level 3 environments. Report rationalization happens systematically: duplicates and low-value reports are identified through usage analysis and consolidated. Certified reports surface prominently through Portal Pages, department-specific landing pages that guide users directly to trusted, role-relevant content.
Three capabilities define the Level 3 to Level 4 breakthrough:
Automated metadata ingestion: Catalog entries are populated and refreshed automatically from BI platform APIs. Brown-Forman's governance framework operates across 4,000+ users because metadata flows into Atlas from connected BI tools without manual intervention.
Usage-based rationalization: Usage tracking identifies reports that are never consumed, duplicates that create conflicting metrics, and the high-value certified content that should be promoted. Bimbo Bakeries USA's elimination of 25 SharePoint sites across 53 bakeries was driven by usage data that made the rationalization case self-evident.
Cross-tool cost visibility. BI spend is correlated to asset-level value: what each report costs to maintain versus the business decisions it supports. This gives analytics leaders the financial language to defend governance investment.
Brown-Forman achieved a 30% report reduction and 27% analytics adoption increase year-over-year. Bimbo Bakeries USA improved report discovery time by 5 to 10% and saved approximately 5 hours per month in publishing effort.
For organizations managing Power BI at enterprise scale, see Power BI Governance at Enterprise Scale.
Typical profile: Enterprise-scale (1,000+ analytics users), post-consolidation or actively planning BI migration.
Level 5: Optimized (AI-Ready Governance and Workflow Execution)
Level 5 extends governance beyond cataloging and rationalization into two domains: making analytics AI-ready and embedding governance into operational business workflows.
As organizations deploy AI copilots and conversational analytics tools, those AI systems need to understand how the organization defines and measures performance. Without governed, contextualized metadata, AI outputs are unreliable: inconsistent metric definitions, naming conflicts across departments, and unresolved aliases produce hallucinated or contradictory answers.
ZenOptics Nexus provides the analytics context layer that solves this. Nexus builds a semantic knowledge graph that maps KPIs to business concepts, resolves naming conflicts across departments, and standardizes metric definitions. Every AI query is grounded in certified, governed metric definitions rather than raw, uncontextualized data.
ZenOptics Maestro embeds governance into operational workflows. Instead of governance ending at the point of analytics consumption, Maestro turns analytics insights into governed, traceable business processes with built-in reviews, approvals, and audit trails. Its workflow library spans Finance, Legal, HR, Sales, and IT. ZIVA, the AI assistant, generates workflows from natural language. Every workflow captures decision provenance: what data informed the decision, who approved it, and what happened after.
Level 5 organizations are positioned for AI-driven analytics growth because their governance infrastructure provides the semantic context AI needs to operate accurately, and the workflow guardrails to ensure governed execution.
Typical profile: Enterprise-scale (5,000+ analytics users) with advanced analytics maturity. Level 5 is not a destination. It is a continuous operating state.
Quick Assessment
Your overall maturity level is determined by the lowest dimension, not the highest.
| Dimension | Level 1 (Ad Hoc) | Level 2 (Reactive) | Level 3 (Defined) | Level 4 (Managed) | Level 5 (Optimized) |
|---|---|---|---|---|---|
| Governance Structure | None | Reactive, spreadsheet-driven | Documented, CoE-led | Automated, cross-tool | AI-enabled, continuous |
| Catalog and Visibility | No central catalog | Partial catalog, manual | Centralized catalog, metadata complete | Automated ingestion, usage tracked | Predictive curation |
| Access Control | Fragmented, per-tool | Manual, policy-based | Standardized, manual enforcement | Automated, role-based | Intelligent, contextual |
| Cost Visibility | None | Estimated | By platform | By platform and usage | By asset ROI |
| User Adoption | Low, siloed discovery | Moderate, perceived friction | Moderate, growing | High, self-serve certified content | High, frictionless innovation |
Three diagnostic questions for quick placement: How long to produce a complete analytics asset inventory? How quickly can you respond to a compliance audit on BI access? How do you measure ROI on BI investments at the individual asset level?
For a detailed audit methodology, see How to Audit Your BI Environment Before a Migration.
Industry-Specific Patterns
CPG and Food & Beverage
Multi-site complexity (20 to 50 manufacturing plants generating independent reports across different BI tools and metric definitions) drives severe analytics sprawl. FDA inspection readiness, FSMA compliance, and financial audit requirements push CPG organizations to Level 3 faster than less regulated industries. The cost reduction dimension then accelerates Level 3 to Level 4 progression, as Brown-Forman and Bimbo Bakeries USA demonstrated through direct license savings and operational overhead reduction.
For a detailed CPG governance framework, see Analytics Governance for CPG.
Insurance Carriers
Insurance carriers advance quickly to Level 3 because state insurance commissions, NAIC reporting, and SOX mandate documented governance. The Level 3 to Level 4 challenge is cultural: actuarial, claims, and underwriting teams each maintain their own analytics environments, and consolidation meets resistance. Pairing governance with self-service discovery through Atlas shifts the perception from compliance gate to productivity enabler.
Federal Agencies
FedRAMP compliance requirements, classified/unclassified environment separation, and extended procurement cycles constrain advancement. Most federal analytics environments sit at Level 2 to Level 3. ZenOptics partners with Y Point Analytics, the authorized federal reseller, and holds Federal UEI (LNJ1YFH14ZM6) and CAGE Code (8MNB5).
Frequently Asked Questions
What is the difference between data governance and analytics governance?
Data governance manages raw data quality, lineage, and metadata at the source layer. Analytics governance manages the artifacts built on top of that data: reports, dashboards, KPIs, and metrics. Both are necessary, and neither substitutes for the other. ZenOptics Atlas is an Analytics Catalog, not a Data Catalog. It inventories, certifies, and tracks analytics assets across BI tools without requiring data migration.
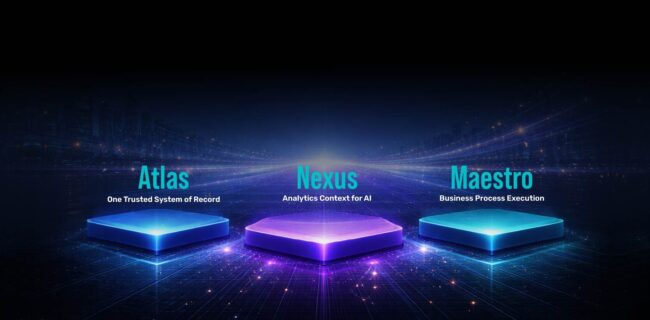
How does the three-layer platform architecture (Atlas, Nexus, Maestro) map to the maturity model?
Atlas provides the analytics system of record required at Levels 3 and 4: cataloging, governance, connectors, usage tracking, and rationalization. Nexus adds the semantic context layer for Level 5 AI readiness: knowledge graphs, metric standardization, and AI grounding. Maestro extends governance into operational workflows: governed business processes, decision provenance, and AI-assisted workflow creation through ZIVA.
How do we measure the ROI of analytics governance?
Across four dimensions: trust and adoption (certified content consumption, time-to-discovery), cost reduction (license savings from rationalization, compute savings from retiring unused reports), risk reduction (audit readiness, reduction in findings), and productivity (time saved in report discovery, faster onboarding). Brown-Forman's 30% report reduction and 27% adoption increase, and Bimbo Bakeries USA's 5 hours per month saved and 25 eliminated SharePoint sites, are examples of measurable governance ROI.
Published March 23, 2026Assess Your Analytics Governance Maturity
The maturity model maps a clear progression: Atlas as the analytics system of record at Levels 3 and 4, Nexus as the semantic context layer for AI readiness, and Maestro for embedding governance into operational workflows at Level 5.
Schedule a 30-Minute Strategy Session