


Power BI now serves over 35 million monthly active users across 550,000 organizations. At that scale, the same self-service capability that drives adoption creates a governance problem: workspace sprawl, duplicated datasets, inconsistent access controls, and license costs that grow faster than the value they deliver.
This guide provides a practical framework for governing Power BI at enterprise scale, from workspace structure and dataset ownership through usage monitoring and cost optimization. For organizations operating Power BI alongside other BI tools, it also addresses how unified analytics governance eliminates the overhead of managing separate governance processes per platform.
The Power BI Governance Challenge
Power BI's low barrier to report and workspace creation accelerates adoption, but without governance guardrails, it also accelerates analytics sprawl. Enterprise Power BI environments commonly face five compounding challenges.
Workspace proliferation. Users create workspaces without a provisioning process, naming convention, or lifecycle policy. IT lacks cross-workspace visibility and has no efficient way to identify dormant or redundant workspaces.
Dataset duplication. When business users cannot find certified shared datasets, they build their own. This creates duplicate data pipelines, conflicting metric definitions, and unnecessary compute costs.
Row-level security gaps. Implementing RLS across dynamic security rules at enterprise scale requires coordination between data engineers, Power BI developers, and security teams. Incomplete or untested RLS creates audit risk and unintended data access.
License and capacity cost opacity. Power BI licensing spans per-user licenses, Premium capacity, Fabric capacity, and embedded licenses. Without asset-level usage correlation, organizations overspend on capacity for content that is rarely consumed.
Access control fragmentation. Power BI's native sharing model (workspace roles, sharing settings, security groups) produces inconsistent access patterns when workspaces span business units and geographies. Compliance audits regularly surface unexpected access, and remediation requires manual investigation across each workspace.
Five Governance Layers
Effective Power BI governance spans five layers, each with distinct stakeholders and enforcement mechanisms.
Workspace governance. Establish a provisioning process with a request form, approval workflow, and naming convention. Define workspace lifecycle policies: workspaces with no activity for 12 months are flagged for archival. Limit workspace admin assignments to maintain consistency across the environment.
Dataset architecture and ownership. Adopt a semantic layer architecture: a small number of certified shared datasets feeding multiple reports. Assign ownership, documentation requirements, and update schedules for every shared dataset. Track dataset lineage to enable impact analysis before changes.
Report certification. Require every report to have a single owner. Use Power BI's Endorsement features (Promoted and Certified badges) to signal trustworthiness. Establish an archival process for reports with no usage in six months.
Access control and RLS. Use Azure AD groups for workspace access rather than individual licenses. Test RLS rules in development environments before production deployment. Document every RLS rule with the business case and approval chain.
Usage monitoring. Extract consumption data from Power BI Admin portal APIs. Correlate usage to cost: identify which datasets are compute-expensive and rarely used. Track adoption metrics (reports opened per user per month, time-to-discovery for new users) and review quarterly.
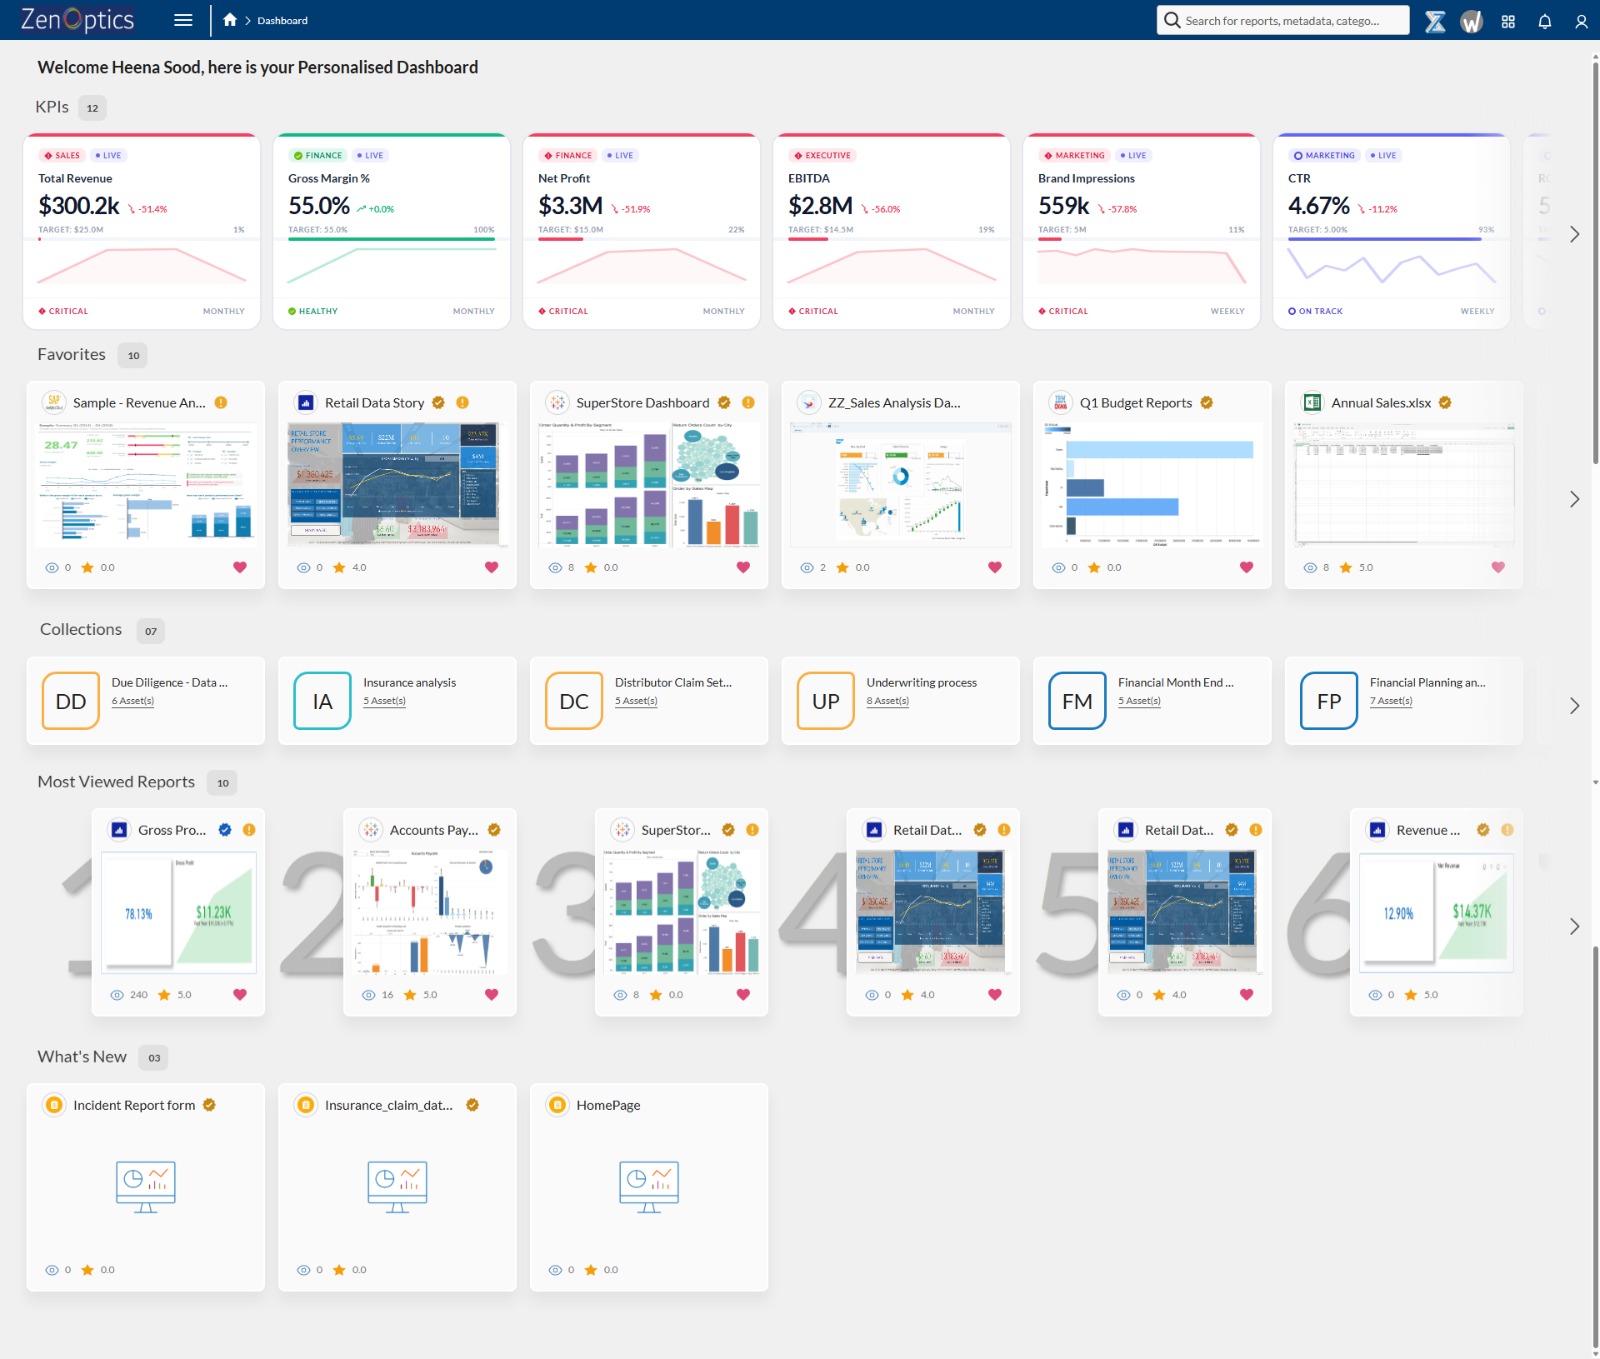
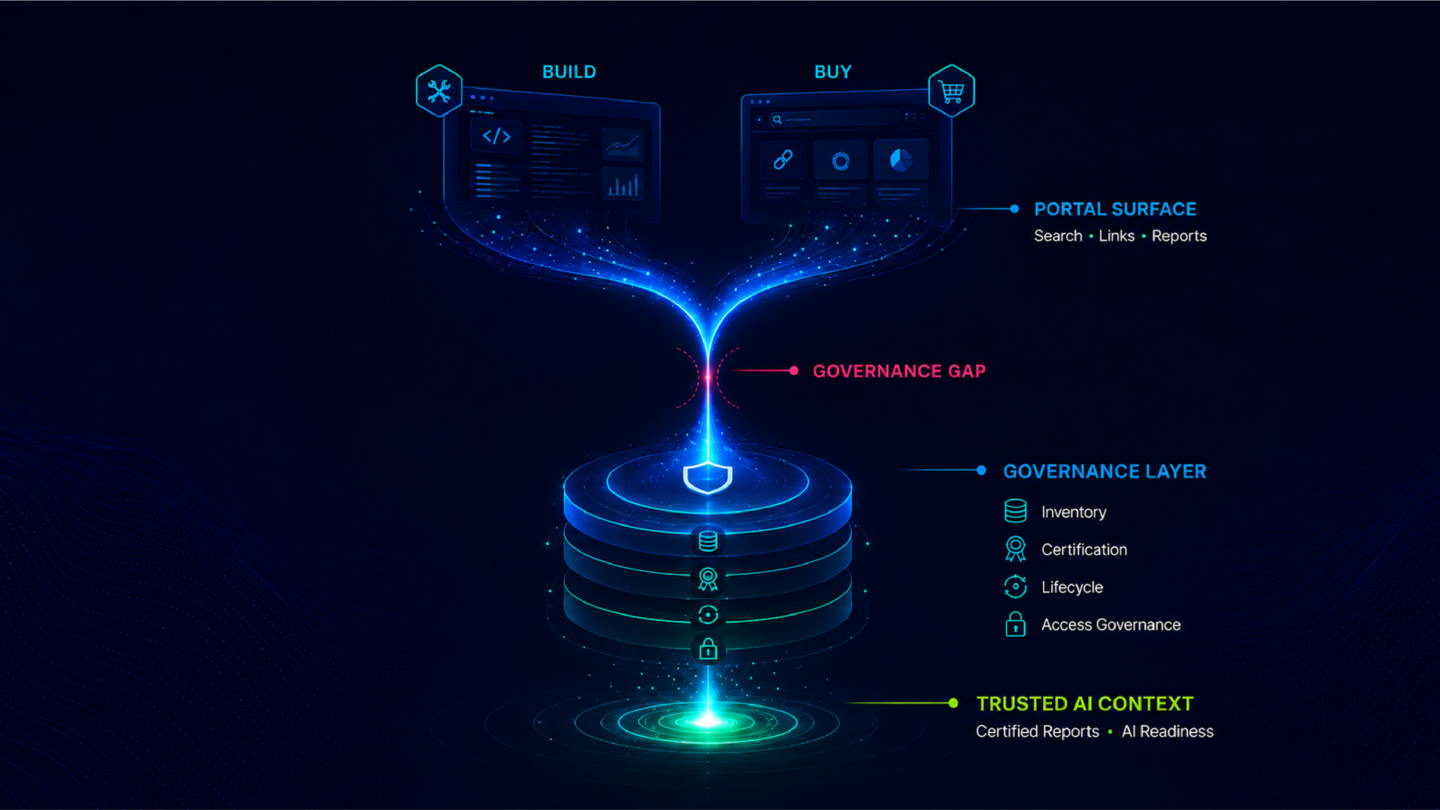
ZenOptics Atlas operates across all five layers as the analytics system of record. It connects to Power BI through native connectors, automatically ingesting workspace, dataset, and report metadata. Atlas catalogs every Power BI asset with certified ownership, lineage tracking, and usage visibility, eliminating the manual catalog maintenance that causes governance programs to degrade over time. Portal Pages surface certified content through department-specific landing pages, reducing time-to-discovery and driving user adoption toward trusted reports.
Governing Power BI in Multi-Tool Environments
Most enterprise Power BI deployments do not exist in isolation. Large organizations routinely operate Power BI alongside Tableau, Qlik, SAP Analytics, or legacy tools like SSRS and Cognos. Each platform has its own governance model, access control mechanisms, and metadata schema. This creates a compounding governance problem that single-tool governance cannot solve.
Without a unified governance layer, organizations maintain separate governance processes per tool. Policies diverge. The same report exists in both Tableau and Power BI because users cannot discover the authoritative version across tools. License costs are tracked per platform, making total BI spend invisible.
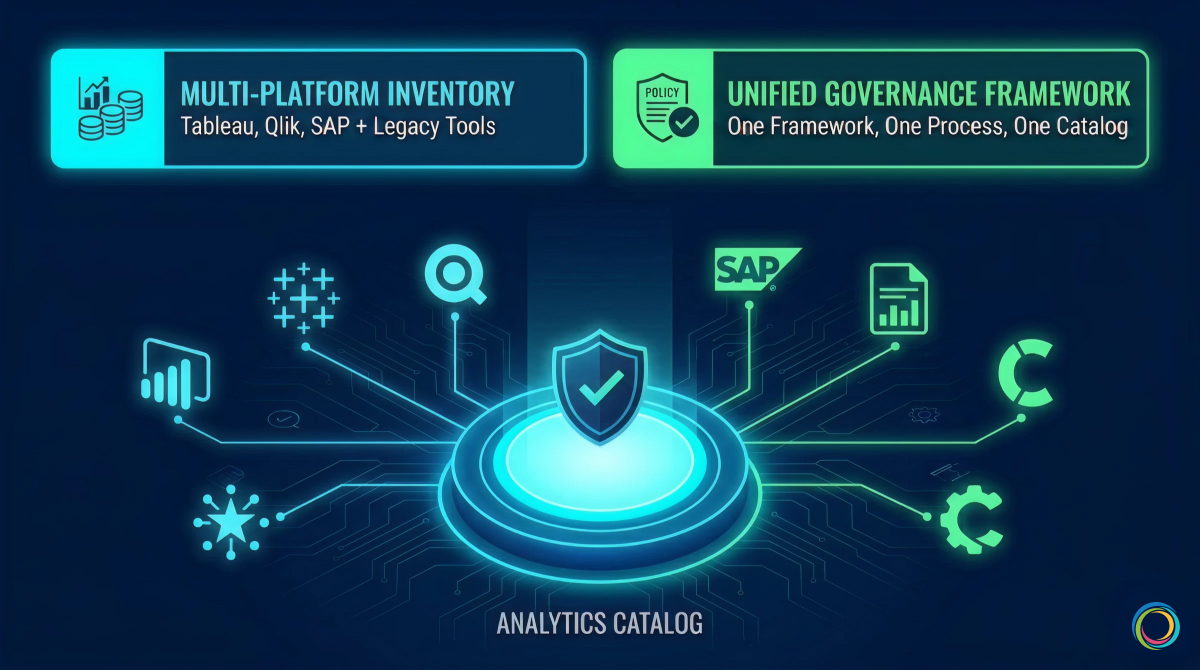
Atlas solves this by inventorying analytics assets across all BI tools in a single Analytics Catalog. One governance framework, one certification process, one access request workflow applies regardless of platform. Usage tracking across tools identifies cross-platform duplicates and rationalization opportunities that remain invisible when governance operates in tool-specific silos.
Brown-Forman unified 4,000+ users across their multi-tool BI environment, achieving a 30% report reduction and 27% analytics adoption increase year-over-year through cross-tool visibility and usage-based rationalization.
Implementation Roadmap
Power BI governance does not require a large upfront investment. Start narrow and expand.
Months 1 to 3 (Assessment). Inventory all Power BI workspaces, datasets, and reports. Map stakeholders: workspace admins, dataset owners, report developers. Document current governance practices and identify the highest-friction pain points. Atlas accelerates this phase by ingesting all Power BI metadata automatically, providing a complete inventory and usage baseline within weeks.
Months 2 to 4 (Framework). Define governance policies for workspace provisioning, dataset certification, report ownership, and RLS standards. Establish a BI Glossary for standardized metric definitions. Document policies in a governance charter that serves as the single reference for all governance stakeholders.
Months 4 to 6 (Pilot). Pilot governance policies with one business unit (Finance and Marketing are common starting points because they have clear data boundaries and compliance sensitivity). Collect feedback from workspace admins and report consumers. Adjust policies based on real-world friction before scaling. Train workspace admins on consistent enforcement.
Month 6 onward (Scale). Roll out governance organization-wide. Expand to multi-tool governance if running Power BI alongside other platforms. Optimize based on quarterly usage reviews: retire low-value content, promote high-engagement reports, and right-size capacity allocations based on actual consumption patterns.
Metrics That Matter
Governance success is measured by business outcomes, not compliance checklists alone.
| Metric | Target | Why It Matters |
|---|---|---|
| Workspace utilization rate | > 85% active | Unused workspaces are candidates for archival |
| Dataset reuse ratio | > 3 reports per shared dataset | High reuse signals a healthy semantic layer |
| Report certification rate | > 70% | Higher certification drives user confidence |
| Time-to-discovery | < 1 week for new users | Governance should reduce discovery friction |
| RLS compliance rate | 100% for sensitive datasets | Critical for audit readiness |
| Cost per active user | Trending downward | Direct measure of governance ROI |
For a broader framework that positions Power BI governance within organizational analytics maturity, see The Analytics Governance Maturity Model.
For a pre-migration audit methodology, see How to Audit Your BI Environment Before a Migration.
Frequently Asked Questions
How does ZenOptics ingest Power BI metadata?
Atlas connects to Power BI through native connectors that pull workspace, dataset, and report metadata via Power BI Admin APIs. Ingestion is automated: new workspaces, reports, and datasets are cataloged without manual data entry. Metadata refreshes on a configurable schedule to keep the catalog current.
Can ZenOptics govern Power BI alongside other BI tools?
Yes. Atlas catalogs analytics assets across Power BI, Tableau, Qlik, SAP, and MicroStrategy in a single unified view. One governance framework applies across all tools: the same certification criteria, the same access request process, and the same ownership model. This eliminates the overhead of maintaining separate governance processes per platform.
What is the typical implementation timeline?
Most organizations achieve a functioning governance baseline within three to six months. The first phase (inventory and assessment) typically completes within four to six weeks because Atlas automates metadata ingestion. Policy definition, piloting, and organization-wide rollout follow in subsequent phases. Organizations with existing governance documentation and defined ownership structures often move faster through the framework phase.
Published March 27, 2026Start Governing Power BI at Scale
See how Atlas catalogs your entire Power BI environment, enforces governance policies across tools, and provides the usage intelligence to drive rationalization and cost savings.
Schedule a 30-Minute Strategy Session