


The paradox of modern analytics is getting harder to ignore. Organizations keep investing more in governance, yet trust in analytics stays stubbornly low.
Gartner research reveals that poor data quality costs organizations an average of $12.9 million per year. Meanwhile, Gartner also predicts that by 2028, 50% of organizations will implement zero-trust data governance because they can no longer implicitly trust their data. More investment in governance. Less confidence in outcomes. Something is clearly misaligned.
The disconnect is not mysterious. Traditional governance efforts tend to stop at the data warehouse or pipeline. They rarely extend to the consumption layer, where business users actually interact with reports, dashboards, and KPIs. Organizations can have well-governed data tables while the analytics built on top of them remain fragmented, duplicated, or poorly understood. This is the core challenge behind what we call the Data Trust Gap.
This is where Data Trust Scores play a role. Not as a universal standard, but as a practical framework for surfacing trust signals at the point of decision-making. A trust score helps teams assess how reliable a specific report or dashboard is for use, complementing data quality efforts with visibility into analytics consumption.
What Data Trust Scores Actually Measure
A data trust score works like a credit score for analytics assets. It combines multiple signals into a single, interpretable view that helps users gauge risk before acting on a report or dashboard.
Gartner's data governance framework defines core data quality dimensions at the data layer: accuracy, completeness, consistency, timeliness, validity, and uniqueness. At the analytics consumption layer, trust assessment extends beyond these technical metrics to include additional context:
Accuracy and consistency: Do reported metrics align across tools and teams?
Freshness: Is the data current enough for its intended decision?
Completeness: Are key dimensions and filters populated?
Ownership: Is there a clearly accountable owner?
Certification status: Has the asset been reviewed and approved through proper certification workflows?
Usage signals: Is the asset actively referenced or consistently avoided?
Usage alone does not equal trust. Some reports are niche or infrequently used by design. But when usage patterns are evaluated alongside quality, ownership, and certification signals, they provide meaningful insight into an asset's relevance and reliability over time.
The financial stakes are significant. Industry research shows that many organizations still do not consistently measure data quality, contributing to millions in annual losses from rework, validation, and delayed decisions. When analytics are not trusted, teams manually verify numbers, create shadow dashboards, and slow decision cycles while seeking confirmation. This is BI Sprawl in action.
Building a Practical Trust Score Framework
There is no universal formula for data trust scores. And there shouldn't be. Effective trust models reflect an organization's specific decision context and risk tolerance.
Many organizations begin with weighted scoring models that combine multiple signals. An illustrative example might include:
- Accuracy and consistency: approximately 30%
- Freshness: approximately 25%
- Completeness: approximately 20%
- Ownership and lineage clarity: approximately 15%
- Usage and engagement signals: approximately 10%
These weights are directional examples, not prescriptive best practices. What matters more than the exact math is transparency. Users should understand why an asset has a particular trust level and what actions would improve it.
Clear thresholds also matter. Some organizations define ranges such as:
- High confidence (certified)
- Conditional use
- Use with caution
- Requires remediation
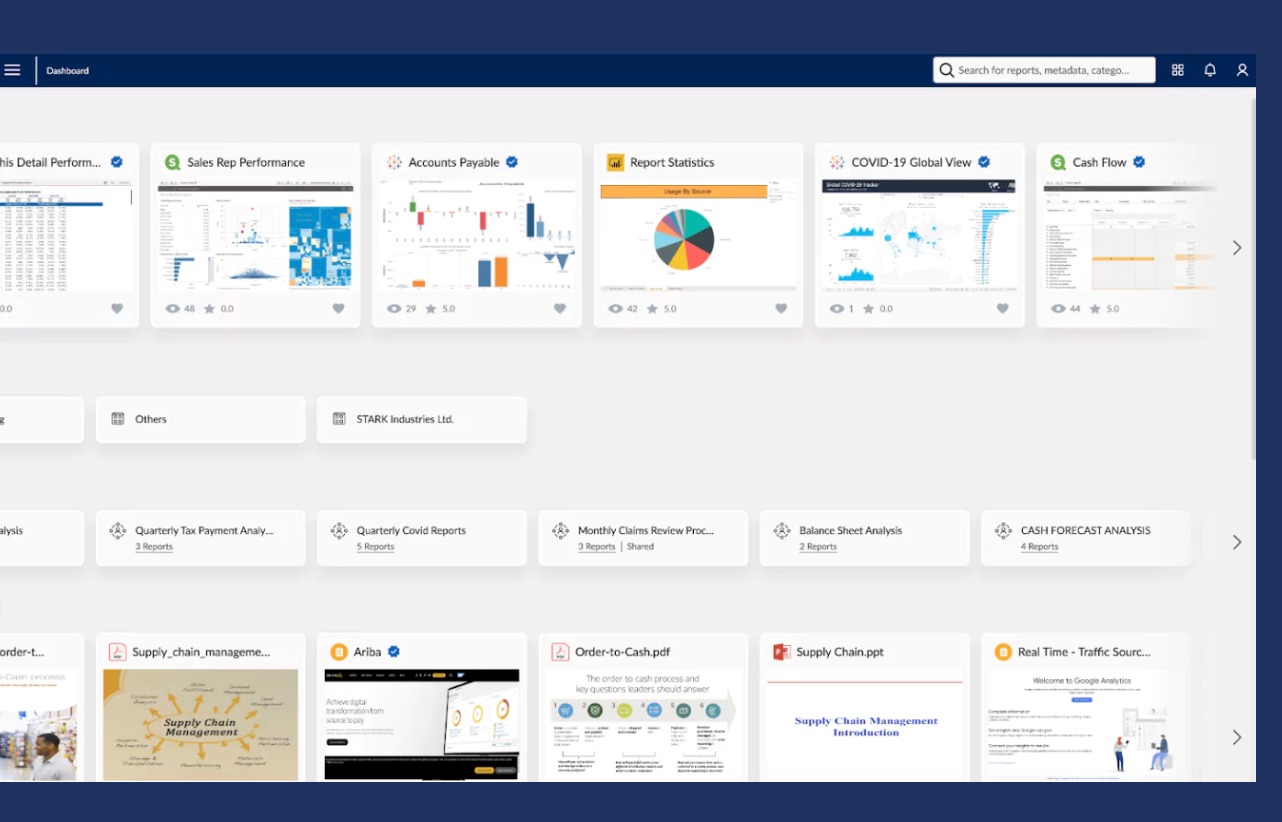
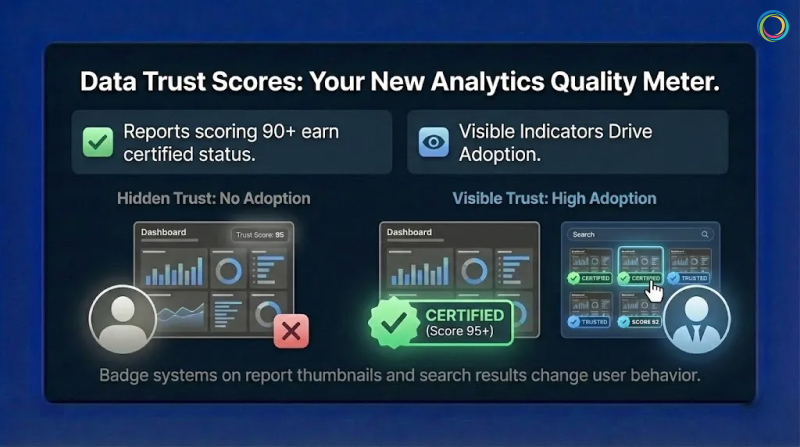
Visual indicators like badges and color coding help users interpret trust quickly without needing to analyze scores in detail. This approach aligns with building a true Single Source of Truth for enterprise analytics.
One common mistake is calculating trust scores but hiding them. Trust indicators that users cannot see do not change behavior. Visibility in search results, asset thumbnails, and detail panels drives adoption and accountability.
Certification Workflows That Create Accountability
Automated scoring alone is not governance. Certification introduces human judgment into the trust process.
A typical certification workflow includes:
- Asset documentation by the owner
- Technical review of data sources and calculations
- Business review to confirm relevance and intent
- Approval that grants certified status
Certification should be continuous, not permanent. Assets should be re-evaluated based on:
- Time-based reviews
- Significant data or logic changes
- Declining trust signals
Every report or dashboard should have a clearly designated owner. When ownership is explicit, accountability follows. Owners receive notifications when assets degrade and are responsible for remediation or recertification. This creates incentives for quality that static governance policies rarely achieve.
Effective Analytics Governance builds these workflows directly into the user experience, making certification visible and actionable.
Scaling Trust Across Multiple BI Platforms
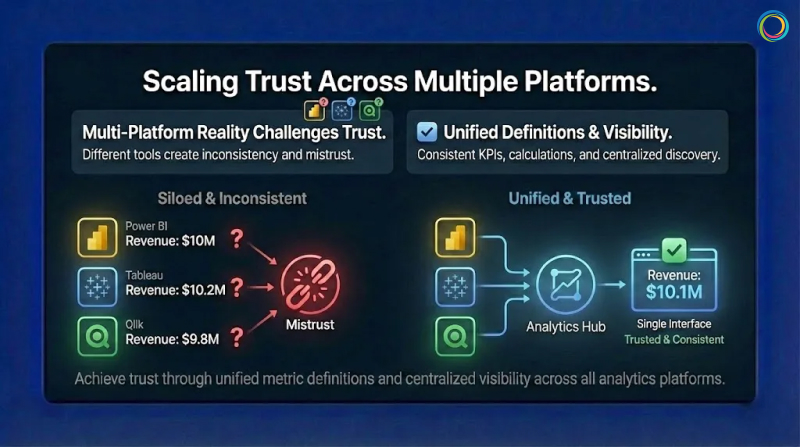
Most enterprises operate across multiple BI platforms: Power BI, Tableau, Qlik, and others. Each platform defines governance and quality differently, which makes trust difficult to compare at scale.
Gartner research indicates that organizations with multiple BI tools face increased complexity in maintaining consistent data definitions and governance standards.
Effective multi-platform trust requires:
Unified metric definitions so KPIs mean the same thing everywhere
Consistent trust signals applied across platforms
Centralized visibility into analytics assets through an Analytics Catalog
This does not require replacing existing tools. It requires a shared analytics context layer that enables comparison and clarity while allowing teams to continue working in their preferred platforms.
The goal is cross-platform visibility that eliminates Report Sprawl and surfaces trust signals regardless of where assets live.
How ZenOptics Enables Data Trust at Scale
ZenOptics does not impose a rigid scoring standard or black-box algorithm. Instead, it provides the analytics context and infrastructure needed to surface trust signals consistently across BI environments.
With ZenOptics, organizations can:
- Create a unified inventory of analytics assets across platforms through the Analytics Hub
- Capture metadata related to ownership, lineage, and usage
- Enable certification workflows with visible trust indicators
- Monitor trust trends, adoption, and remediation progress
- Deliver personalized analytics experiences
By making trust signals visible and actionable, ZenOptics helps teams move from reactive governance to confidence-driven analytics consumption.
Frequently Asked Questions
What is a data trust score?
A data trust score is a directional indicator that summarizes multiple quality, governance, and usage signals to help users assess whether an analytics asset is reliable for decision-making.
How is a trust score calculated?
Organizations typically combine weighted signals such as accuracy, freshness, completeness, ownership, certification, and usage. The specific model varies based on context and risk tolerance.
How is data trust different from data quality?
Data quality focuses on raw data accuracy and integrity at the data layer. Data trust extends to the analytics layer, evaluating the reports and dashboards people rely on to make decisions. This distinction is why traditional Data Catalogs alone cannot solve the trust problem.
Why do organizations struggle with analytics trust?
The primary cause is that governance stops at the data layer. Business users do not query databases directly. They open reports and dashboards. When governance never reaches this consumption layer, the Data Trust Gap persists regardless of underlying data quality.
Conclusion
Data trust is not about governing databases. It is about governing the analytics people actually use.
By surfacing trust signals, making certification visible, and creating clear ownership, organizations reduce validation waste, eliminate redundant shadow reports, and accelerate decision-making.
Data trust scores do not replace judgment. They support it. And in complex analytics environments, that support makes all the difference.
Ready to build trust in your analytics?
Request a demo to see how ZenOptics can help your organization establish confidence in enterprise analytics.
Data Trust Scores: Your New Analytics Quality Meter
Learn how data trust scores transform analytics governance. Discover the framework, metrics, and certification process to ensure confident decision-making.
Schedule Your Assessment