


The understanding and interpretation of data is not always self-evident. Analytics assets such as reports, dashboards, and visualizations require at least a basic level of data and analysis skills as well as some understanding of the content in order to properly interpret the information and make decisions.
When people have questions about the content within an asset, they usually turn to their immediate colleagues, the report producer, or the owner to seek answers. Yet all too often, the same questions keep arising, or there becomes a pattern of misunderstanding, perhaps because people forget the answers to their questions, or they don’t understand them in the first place. This creates inefficiencies and adversely affects productivity and decision-making, which are hidden costs that compound with the growth of an organization.
Establishing a process of collaboration that documents the communications helps prevent recurring questions and creates efficiencies over time. According to Gartner, “Collecting different perspectives on data to establish a cohesive understanding is critical for decision-making. Data and analytics leaders must introduce collaboration capabilities to achieve analytics democratization.” (1)
When people share an analytics asset, they often do so by attaching the document to an email, providing a link in an email message, or uploading the asset to a collaboration tool such as Slack. Often a thread of communication is created when people ask questions or share insights about the analytics assets.
While the communication and collaboration may be meaningful, the analytics asset becomes nested and buried in the thread of responses. Also, recalling the communication based on a particular analytics asset is an exercise in remembering the topic and then searching and hunting for the information that you are seeking.
These methods prioritize communication and not the analytics asset.

Unlike email or collaboration tools where the focus is on communication and the analytics asset is an artifact that gets buried in the thread of responses, analytics collaboration through an Analytics Hub prioritizes the analytics asset and combines the communication threads.
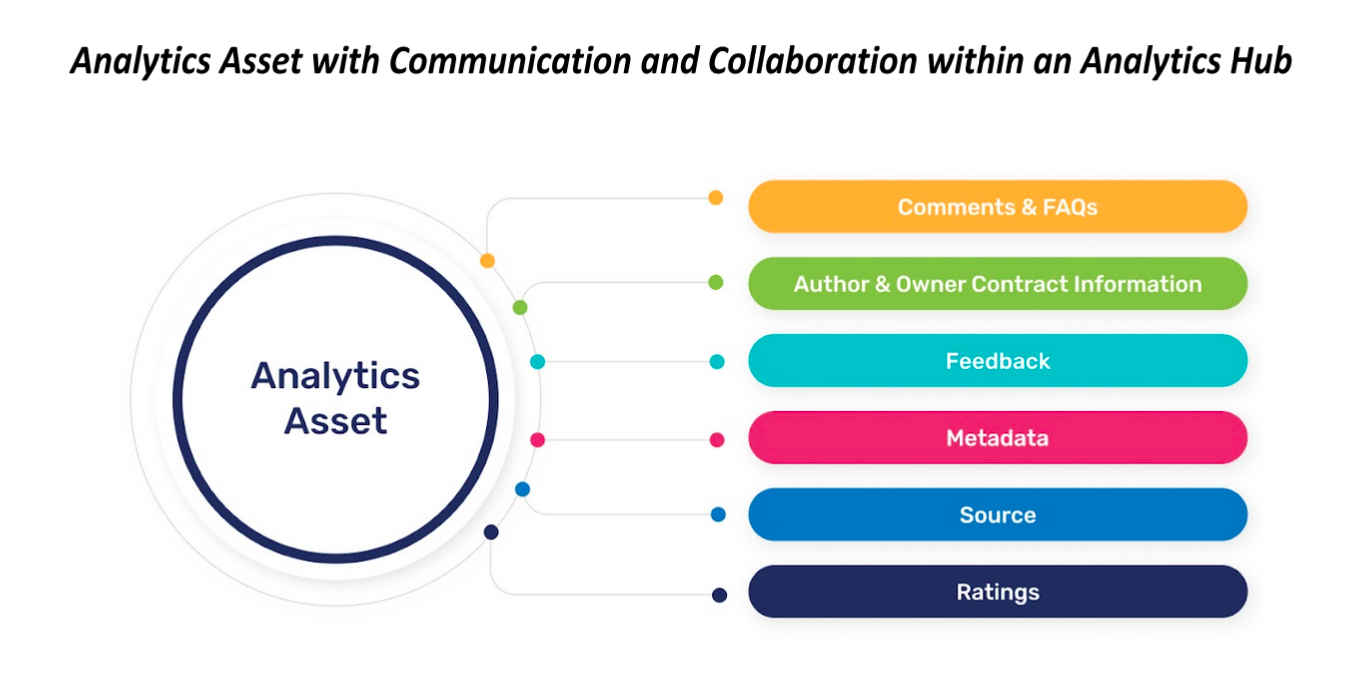
Designed to increase the contextual value of each analytics asset, the Analytics Hub creates a unified view of all the assets and their associated metadata—including comments and other collaborative properties. The focal point is the analytics asset itself, and individuals can increase the understanding and value of that asset by rating it, posting comments, and providing feedback.
In this manner, the important discussions and context about the analytics asset are captured and are easily accessible whenever a particular analytics asset is viewed. (For more information on Analytics Hub components including collaboration, analytics catalog, and BI Portal, read “Analytics Hub: A Single Source for Trusted Enterprise Analytics Assets.”)
“Collaboration is about the application of collaborative capabilities to analytics workstreams for organizations that want to provide an environment where a broad spectrum of users can simultaneously co-produce an analytics project, bringing insights into action,” according to Gartner. (2)
1. Increased Understanding: While each analytics asset has a name, the name by itself is typically not descriptive enough to provide anyone with an understanding of the content. Further, additional contextual information rarely accompanies the asset to describe the content, relevant business rules, metadata, parameters for appropriate use of the information, and business owner or subject matter expert.
For example, in looking at a report called “Sales by Customer,” one would think it would be a listing of customers and the corresponding sales that were made to each customer. Upon further thought, one may have questions such as:
In an analytics hub, this information can be provided and connected with the report itself, eliminating the need for each viewer to wonder and seek answers to the same set of questions. Any subsequent questions can collaboratively be explored (asked, pondered, and answered) and preserved alongside the asset. This yields greater clarity and understanding for everyone who views that analytics asset.
2. Improved Analysis: Analytics collaboration functionality within an analytics hub provides individuals an understanding of the content and associated business rules related to an analytics asset and gives them the ability to then determine how best to use the information.
Using the same prior example, if the “Sales by Customer” report contains data that is sourced from the organization’s accounting system, it will contain information that will also be reflected in financial reports used by management. If there is another report called “Customer Sales” that is sourced from the organization’s sales force automation (SFA) system, it will contain information that the sales group uses to track customer sales.
However, the definition of a sale may be different between the accounting and the SFA systems. The accounting system will recognize a sale when there is a fully signed agreement and the product or service has been delivered. The sales force automation system will recognize a sale when there is a fully signed agreement, regardless of whether or not the product or service has been delivered. The difference can be significant.
Knowing the difference between “Sales by Customer” and “Customer Sales” reports will improve analysis because there is a greater understanding of the content that is being examined.
3. Better Decision-Making: Making the best possible decision rests with the information that is being used. If one does not have a full understanding of the information being examined, then the analysis will be off. If the analysis is off, the best possible decision may not be made. So, producing better decisions requires an understanding of the information being examined—which includes the context of the data, the business rules being applied, the source of the data, and the perspectives of other individuals who have used the analytics asset. With a greater understanding of the information, the analyses are improved because individuals have an appropriate contextual appreciation for data within the analytics asset and how it should be best used.
The ability to share understanding and perspectives helps to provide context to the information that is being examined. Analytics collaboration facilitates the ability to provide understanding by gathering ratings, feedback, comments, metadata, sourcing, and other relevant information and combining it with each analytics asset within an analytics hub. Preserving this contextual information alongside the asset allows consistency and efficiency in analysis—without having to rehash questions that have already been addressed.
As a result, analysis, interpretation, and decision-making are improved because an increased level of common understanding is easily delivered and accessible.
References:
1) Sun, J., Pidsley D, (2 September 2022 – ID G00759403) Innovation Insight: Analytics Collaboration (Gartner Inc.)
2) Sun, J., Quinn, K., Pidsley, D., O’Callaghan, G., Ganeshan, A., Long, C., Schulte, W., Popa, A., Macari, E., Fei, F., Schlegel, K., Misclaus, R., Antelmi, J., (17 April 2023 – ID G00772210) Critical Capabilities for Analytics and Business Intelligence Platforms (Gartner Inc.)
In today’s fast-paced business world, having instant access to reliable and accurate data is essential for making informed decisions. However, finding the right information can be daunting, especially when it’s buried under a mountain of reports and dashboards from various systems.
Adopting the principle of “less is more” to reduce report duplication and unused or outdated reports can empower organizations to make data-driven decisions with greater accuracy and speed, giving them a competitive edge. On the other hand, an overwhelming abundance of unorganized and unverified analytical assets can hinder access to the information needed, exacerbating confusion and complexity.
Like many organizations, Illumina, a global biotech company, faced these same issues. In a recent ZenOptics webinar, Obay Mouradi, Illumina’s senior manager of Data Informatics, discussed their strategic approach to resolving the analytics challenges their organization faced, which largely resulted from report clutter and reporting sprawl. Illumina also shared how they simplified access to trusted reports and dashboards with ZenOptics Analytics Hub.
“[We] are a global company with several sites around [the world] in all different kinds of time zones in Europe, Asia, and North America,” said Mouradi. “We’re hyper-decentralized in terms of our analytics,” said Mouradi. “[There are over] 100 people building Tableau reports across 50 different areas of the business. So there’s this concept of, ‘Do I know what my neighbor’s doing?’”
As a result, employees who needed information had difficulty finding and trusting the reports, dashboards, and visualizations available. Mouradi also said that his organization experienced challenges associated with siloed reporting.
“That’s something we’ve definitely experienced,” he said. “Even our executive leadership sometimes [had] to shoot out many emails to try to get the data they need. And those emails get forwarded and forwarded and forwarded, which leads to a lot of [inefficiencies]. And when you do get the data, how do you know you can trust it?”
Mouradi said that ZenOptics Analytics Hub provided Illumina with a single interface and capabilities that helped them streamline their reporting environment by eliminating outdated or unneeded reports and centralizing trusted reports and dashboards to simplify discovery and access for users.
Mouradi stated that before working with ZenOptics, they developed a Center of Excellence (COE) to break down organizational information silos. He mentioned that one of the COE’s main goals was to integrate data from many platforms and business functions into one place. Users can categorize reports, browse them by business function, and quickly find certified key reports. He went on to say that this entailed creating a methodology and standardizing it globally.
“So that way, we can get the best information,” Mouradi said.
Aside from centralization, Mouradi said that automation was just as crucial. “When people add new reports, it’s a huge problem for us to try to sustain a catalog,” he said.
He said that ZenOptics gave them the centralization and automation they needed to identify and sunset the duplicate or unneeded reports in their source systems, which made it easier for users to find the information they required to make decisions. According to Mouradi, the feedback from their employees and leadership has been overwhelmingly positive, with one VP calling it a “dream come true.”
Mouradi went on to say that the ZenOptics software implementation and customer success teams assisted the Illumina team with guidance and best practices to reduce report clutter, thereby only retaining critical reports that executives most cared about and that supported business goals.
“Leaders can get to the information they need in a much more efficient way [through the use of ZenOptics Analytics Hub] rather than just emailing a whole bunch of people. trying to just dig around, or having 100 bookmarks,” Mouradi said.
By centralizing analytics and automating catalog maintenance, Illumina reduced the number of reports from thousands to hundreds. This ensured key reports were easily accessible and in line with their business needs and objectives.
Report clutter and tool sprawl are major obstacles to finding reliable information quickly for organizations across all industries. An analytics hub that eliminates clutter and simplifies access to trusted reports and dashboards can address these challenges.
ZenOptics offers an analytics hub platform that helps organizations achieve the full potential of their analytics assets and the people using them.
To have a first-hand look at how the ZenOptics Analytics Hub functions, kindly register for a personalized demo through this link.
The proliferation of self-service business intelligence (BI), embedded analytics, advanced analytics, and other software technologies that provide analytics are commonplace in organizations large and small. Yet many individuals within these organizations struggle to understand what analytics are available, where they can be found, and what information they provide.
To address these needs, analytics catalog technology was created to compile a listing of analytic assets that are rendered or made available via a BI Portal. Behind the scenes of the technology, an analytics catalog captures and stores the metadata about each of the analytic assets to provide standardization and additional context for consumers of the information.
Not all digital documents within an organization are analytics assets. For example, a single-purpose document, such as an employee expense report for the month of November or an October customer purchase order, is static and stored as supporting information in the accounting system of an organization.
An analytics asset is a structured report, dashboard, or visualization that provides information from a data repository. For example, a customer report may list the customer names and the amount of revenue generated for a specific time period. The customer report could be run to display information for the month of October (or whatever time period is desired).
The advent of self-service BI unleashed the ability for anyone with access to the business information to create analytics assets—rather than relying on someone from IT for assistance to build a report or dashboard. While IT no longer was a “bottleneck” for these resources, the discipline of consistently substantiating and validating the accuracy of an analytics asset was lost; this was the trade-off of embracing self-service BI—a challenge that we still grapple with today.
It is not uncommon for organizations to have multiple BI tools and applications that serve as best-in-class technology for rendering information in a meaningful manner. While it is a best practice to deploy the appropriate technology for a specific purpose, each tool, application, and platform contains a tremendous quantity of analytics assets available for use.
Many organizations that we work with have thousands to tens of thousands of analytics assets that have been created as a direct result of self-service BI and that exist in a variety of underlying sources. Yet self-service also introduces challenges. If an individual can’t find exactly what they looking for, they simply create a new one—one that may be a duplicate (or very similar).
An additional challenge is that, in many cases, analytics assets have the same name with different content or different names with the same content. In either case, figuring out which analytics asset to use and trust is challenging and time-consuming.
For example, an analytics asset named “Revenue Report” may display gross revenue, net revenue that is gross revenue less discounts, or some other variation. Unless there is a good description of the report and the identification of the business owner who can be contacted with questions, trying to figure out if the revenue displayed is gross, net, or something else is an exercise in frustration.
The purpose of an analytics catalog is to address these types of challenges. A best practice for implementing an analytics catalog is to curate the assets before publishing them within the analytics catalog. The process of curating is applying a discipline of reviewing each analytics asset and ensuring that the:
The exercise of curating analytics assets is also a critical component of an analytics governance program that ensures decision-making and analysis are performed using trusted and certified assets.
Once analytics assets have been curated, the next step is for the items to be organized in a manner that is intuitive and useful for individuals to search and discover. A best practice is to create a process of organizing analytics assets by subject matter, business function, business unit, legal entity, or whatever systematic structure that is meaningful to your organization. Organizing analytics assets provides a structure for access, context, and usage.
After an overarching structure of the organization has been defined, the next step is to create categories within the analytics catalog. For example, if an enterprise software company wants to organize its analytics assets by business function then its categories would be:
Creating categories and then subcategories classifies analytics assets in a meaningful manner for individuals needing that information.
The curation, organization, and categorization of analytics assets in an analytics catalog facilitates the discovery and usage of trusted analytics assets that are available for business users and provides information about where they are sourced or produced as well as the business and technical definition. An analytics catalog combined with a BI Portal establishes a single interface for users to access enterprise analytics assets and search by name, category, content, and/or metadata. As a result, individuals can discover the analytics assets that they have access to as well as those that they don’t have security permission. In those cases of non-access, users can request permissions directly within the tool, and a steward (or organizational role) will assess the appropriateness of the request.
The combination of a BI Portal with an analytics catalog lays the foundation of an Analytics Hub that ultimately provides increased usage of BI; greater efficiency, productivity, and confidence in working with analytics assets; and improved decision-making capabilities.
Read our Brown-Forman customer case study to learn about their journey and benefits, both qualitative and quantitative, in implementing ZenOptics. To learn about the comprehensive benefits of Analytics Hubs in driving value from analytics investments, please visit Resources.
Report sprawl has become a prevalent concern for organizations in the age of self-service business intelligence. Because of the simplicity with which reports may be created, published, modified, and shared, it is not uncommon for an organization to have hundreds or even thousands of reports floating around.
While reports are critical for managing operations, with report sprawl, the challenge is that the volume of reports spread across the organization becomes difficult to manage and creates a level of reporting chaos. As ZenOptics CEO Saurbh Khera said in a recent Forbes article, “[report sprawl has] become unwieldy for many companies with massive amounts of data, dozens of tools and reporting applications, even spreadsheets—and with so many parts of the organization accessing reports.”
This blog post highlights the effects of report sprawl and shares how an analytics hub can help.
When an organization is overwhelmed with reports, it can be difficult for employees to find the information they need. This causes them to spend their precious time hunting for information. When they can’t find what they are looking for, they typically create another report in a self-service BI environment. As the number of reports increases, the names of reports become similar or undifferentiated which can lead to confusion regarding what the report contains, the accuracy and whether it’s appropriate for what they need – as well as if all the relevant information has been discovered. Additionally, report sprawl can slow, and even compromise, informed decision making.
Additionally, report sprawl creates a waste of time and resources. Employees must sort through many documents to find what they are looking for. A Gartner survey found that many employees made poor decisions because they didn’t have all the information needed (44%). The proliferation of reports available creates a volume of assets that is difficult to navigate and discover all the relevant information for decision making.
Without a centralized system or process for defining, creating, updating, validating and managing reports, a sprawling and chaotic reporting environment introduces the risk of duplicate or ungoverned information being used for analytics. When individuals and teams can’t easily identify the appropriate, governed reports they should be using, they are likely to create reports independently, without communicating or collaborating with each other. This can lead to duplication of effort, conflicting or inconsistent data, and difficulty in identifying the source of errors or inconsistencies. Organizations may base their decisions on inaccurate or unreliable data, which can be detrimental.
Too many reports in an organization makes it difficult for individuals to comb through all of the information and identify relevant patterns and insights that are needed to make informed business decisions. When there is too much information to process, it can be overwhelming for employees to try to make sense of it all.
As a result, they can inadvertently overlook or ignore valuable information, leading to missed opportunities or suboptimal decisions. According to Gartner, 43% of users “frequently or occasionally failed to notice important information because of too many applications or the volume of information.” The organizational impact is that employees may not recognize all the relevant information and may make poor judgments. This is particularly true when the reports are not organized or prioritized in a way that makes it easy to find the most important information or see the big picture.
It can be challenging, if not impossible, to determine which are the most important reports for the organization and which align with its goals and objectives when there is report sprawl. This is especially the case when there is no centralized method or procedure for defining, creating, updating, and governing reports with a “certified” status for specific use. As a result, individuals may produce reports independently without coordination or visibility of what their peers may be creating.
Report sprawl can also make it difficult to measure the success of the company’s strategies, as it can be hard to track the metrics that truly matter across variations of similar reports in different applications. This can make it difficult to identify areas for improvement and understand the impact of the company’s strategies on the business.
Report sprawl causes employees to become frustrated and dissatisfied due to inefficiencies and challenges within their reporting environment.
Decision-makers are expected to consider all relevant information for the decision at hand, but this is not always straightforward because the sheer volume of reports that exist in a variety of locations across an enterprise is often too much information to easily sift through. Yet the detrimental impact of report sprawl on employees is not always due to information overload. Employees must be taught how to successfully navigate the layers of information that exist. One CapGemini survey, for example, found that 53% of technology executives think that users can easily store, retrieve and analyze the data at all levels of the organization’s value chain. But only 39% of business executives think the same. This set of business executives is likely dissatisfied with the discovery and access process – and may fear missing out on critical information for their decisions.
The constant need to scan through a mountain of reports can be exhausting and frustrating. The inability to make educated decisions can lead to a lack of job satisfaction, high turnover, and difficulties with recruitment.
An analytics hub like ZenOptics helps organizations resolve report sprawl and the associated adverse impacts.
ZenOptics Analytics Hub helps organizations curate and centralize all reports and analytics assets (such as spreadsheets, PDFs, Google Drive resources, etc.), making them easier to manage and govern. The platform makes it easy to discover, access, and share reports, which reduces confusion and improves decision making. The platform also provides analytics governance to ensure a level of confidence by facilitating and indicating “certified” reports as well as standardization for the use of analytics assets – regardless of which business unit or application they may have been created in.. This can help improve an organization’s bottom line by making decisions based on consistent, available information.
ZenOptics Analytics Hub provides a single interface to access the most relevant and important reports: facilitating the alignment of relevant reports with key business objectives while reducing the need for employees to comb through an overwhelming amount of documents to find what they’re looking for. This improves employee satisfaction, as they can make informed decisions, feel more confident about their decisions and their ability to drive value for the organization.
Report sprawl can significantly impact your organization’s efficiency, analytics governance, employee satisfaction, and the ability to make consistent, fully informed decisions.
ZenOptics Analytics Hub reduces report sprawl by curating and centralizing reports, simplifying access to important insights, and facilitating analytics governance. As a result, organizations can streamline their decision-making processes and improve employee satisfaction.
There are many ways to access business information. A traditional approach is to log onto a business intelligence (BI) application, such as Tableau or Power BI, and navigate to the report that you need, search for one you hope exists, or create a new report altogether.
Most organizations have multiple BI applications that require individuals to log onto each of those applications separately in order to find and access the desired report, dashboard, or visualization.
A BI Portal serves as an application layer that simplifies access by providing a single interface to multiple BI applications and their corresponding content.
First-generation BI Portals, in many cases, were simply web pages with a series of links to BI content. Most were developed internally within organizations, if they decided to undertake such an endeavor. Search capabilities were limited to the report names and tags that were assigned to a report. Depending on how sophisticated the BI Portal is, the reports were either static web pages or they were rendered from within the connected BI application.
While first-generation BI Portals provided a centralized point of view for users, they were a maintenance nightmare for information technology departments since the links and tags had to be manually monitored and maintained.
Second-generation BI Portals evolved beyond a series of static reports and web links into an application layer that provided direct connectivity into the underlying BI applications. In many cases, the underlying user security of each of the BI applications was inherited into the BI Portal, thereby providing report-level security of the data.

To enhance user experience, a BI Portal is designed to centralize access to BI reports, dashboards, and visualizations. Through the BI Portal, users can find information from the corresponding connected BI applications.
For example, an organization may use Tableau for its operational reporting and Power BI for its financial reporting. Analysts who need to access operational and financial reporting must log onto Tableau and Power BI separately to obtain that information.
However, a BI Portal that is connected to both Tableau and Power BI allows the user to simply log onto the single interface and access both Power BI and Tableau content without having to log onto each of the underlying BI applications separately. With centralized access, users save time and are more productive.
Another benefit of a BI Portal is that users can search for and discover information quickly and easily without having to navigate across multiple systems. Users also want their tools to be intuitive so that they don’t need much training in order to utilize these resources effectively.
A good BI Portal allows users to access the information they need, in the way that makes sense to them. The portal should be easy to find what you need, and it should be easy for users to navigate through. This means that they don’t have to learn how to use separate tools for each type of content. Users can search for content by title or keyword, view any related items (such as related reports or dashboards), drill down on the visualizations in a report, filter the data behind a visualization, and more.
BI Portals are an important way to access business information in a user-friendly way. This allows everyone—from executives to managers to salespeople—to be able to easily find and use the information they need when they need it. BI Portals make it easy for anyone within an organization to get their hands on everything from sales data to customer metrics.
Based on my past experience and observations, BI teams (composed of individuals who implement BI applications and create and maintain the BI application and corresponding reports, dashboards, and visualizations) spend one-third to two-thirds of their time answering basic inquiries about BI application connectivity and the names/content of reports from business users.
With a BI Portal, connectivity is a simple pass-through of user access/security rights and a self-service environment that enables users to easily find and access the content they need.
The evolution of BI Portals continues. In recent years, the introduction of analytics hub technology has essentially taken second-generation BI Portals beyond BI applications to amplify value across the entire analytics ecosystem.
While the core of an analytics hub is a BI Portal, an analytics hub provides users access to reports, dashboards, and visualizations that are embedded within applications (such as Salesforce.com), documents located in the cloud or network drives (such as PDFs), spreadsheets, and other report types that are part of the modern technology stack.
In addition to BI Portal capabilities, analytics hubs incorporate analytics catalog, collaboration, automation, and governance components. Information about analytics hubs can be found here.
BI Portals are an important way to facilitate access and search capabilities for business information in a user-friendly way. They provide users with a single point of access for reports and dashboards, which can improve the productivity of your organization.
With BI Portals, users can interact with data and dashboards in ways that intuitively make sense to them. The future of BI Portals has evolved into analytics hubs that provide far greater information access, collaboration and automation.
Learn how organizations are using analytics hubs to drive more value from analytics.
In today’s business environment where established organizations seek digital transformations and newer organizations embrace a modern technology stack, one common and persistent goal holds true: the desire to utilize data in the most productive manner for the betterment of the organization.
Innovation in the area of digital data generation, collection, and processing is now well established and embraced by many data-driven organizations. However, the utilization and consumption of data, information, and analytics in the form of reports, dashboards, and visualizations is still undergoing an evolution.
Traditional business intelligence (BI) applications and BI Portals cannot address information formats which now include embedded analytics, augmented analytics, business applications, external documents, and data workspaces. They require a broader and more comprehensive approach to meeting the information needs of business users.
An analytics hub represents the evolution of BI Portals and ushers in a new era of analytics productivity.
The foundational components of an analytics hub are application layers that enhance and provide rich capabilities for business users to search, discover, interact, and analyze information that facilitate business decision-making. These foundational components are all critical to delivering a cohesive, intuitive analytics experience for users. [See Figure 1.]

At the core of an analytics hub is the BI Portal which establishes a single interface for users to access and interact with all their analytics assets—including reports, dashboards, spreadsheets, PDFs, and others—from one place regardless of the underlying tool or application. User productivity increases because they no longer need to separately log on to or be trained on each of the separate BI and reporting applications.
Layered on top of the BI Portal, an analytics catalog serves as the essential technology to create a glossary of existing content—along with appropriate metadata for an enhanced, contextual understanding of terms, metrics, and Key Performance Indicators (KPIs). The analytics catalog further provides users with curated, organized content and the capabilities of classifying, searching, discovering, and understanding the analytics metadata for standardization and consistency. As a result, users can discover the analytical assets that they have access to as well as those that they don’t have security permission. In those cases of non-access, the name and information about the analytic asset are displayed but not the content.
Adding to the capabilities of the analytics catalog, the next layer establishes analytics collaboration. Users benefit from communication tools, the ability to discover and connect with subject matter experts and report owners related to a certain topic of interest, and to connect and share resources directly with individuals and teams—all within the established governance and security parameters. With the example previously mentioned in the analytics catalog description, a request can be submitted for a non-access analytic asset by contacting the business owner who will determine the appropriateness of the request.
One of the unique and critical features of an analytics hub is analytics automation. Here, users are able to automate the assembly of analytic assets from the analytics catalog to support complex analyses and business processes. This further enhances the user experience, improves productivity, and supports analytics governance.
For example, a cash forecast analysis can be automated by assembling analytic assets for current cash balance, check register, accounts receivable aging, accounts payable aging, forecasted sales, and forecasted expenses. Having analytic assets grouped together in a meaningful manner, refreshed for a synchronized period, and shared with a team, establishes a standard analytical process for completing the desired analysis as well as simulates knowledge sharing.
The collection of the previously discussed components, combined with the ability to monitor usage and activities, provides the capabilities for analytics governance. In addition, BI application management can be performed based on user licenses, usage, and analytic assets that are measured and monitored. Value from analytics can be measured based on usage and feedback. With this layer, lifecycle management can be performed from concept to sunsetting of analytic assets.
As the innovator and recognized leader of analytics hub technology by Gartner Group, ZenOptics released its Intelligent Analytics Hub in 2019 and was declared a Gartner “Cool Vendor” for its innovative technology. Today, ZenOptics continues to pioneer innovative capabilities and features that render tremendous business value to users of its technology in the form of increased productivity, greater insights, and confident business decision-making.
ZenOptics has assembled a world-class team of experts in the field of data and analytics, backed by Silicon Valley and global investors, to execute their vision of providing software that enables data-driven organizations to succeed by utilizing trusted enterprise analytical assets. The result is a dedicated, customer-focused team that is passionate about driving analytics value.
Customers across industries worldwide have realized increased value from their analytics and digital transformation initiatives due to the power of an analytics hub to enable business end users. For example, beverages company Brown-Forman uses ZenOptics as a one-stop shop for all reporting needs, therefore establishing an easy-to-access single source of trusted analytics resources.
Global biotech enterprise Illumina amplified the power of its analytics competency center by creating a unified analytics hub to rationalize and simplify its reporting environment. Sysco Canada food services has streamlined its reporting processes for executive reporting, saving time and enhancing productivity for reporting teams and executives.
These are merely a few examples of common use cases organizations recognize to drive increased value from analytics assets. Learn more here to find out what an analytics hub can do for you.
I just finished reading another analyst survey sponsored by technology vendors discussing why organizations struggle to advance their analytics programs. The top priorities read like every other survey of the last couple of years: produce more “advanced” analytics, rollout more self-service analytics tools, and increase “data literacy” skills across the organization. Sounds great if you are looking to sell more software or services. But what about those of us that want to use the existing analytics assets to make better decisions in the context of our digital work?
(While I work for a vendor, I am writing as a frustrated 25-year marketing leader who just wants a simpler approach to using the wealth of analytics resources available to my team and me.)
Over the last ten years, myriad studies have been published that talked about how organizations need to invest in data and analytics as a cornerstone of digital transformation. The challenge is that most digital initiatives have come up short. In a recent Gartner webinar, they said that 72% of digital business transformations missed revenue expectations, and 67% missed profit expectations.
That didn’t stop the Business Intelligence (BI) market from growing to nearly $20 billion in revenue on the promise of self-service analytics (SSA). Why then are we still seeing surveys where only 16% of respondents say that rank-and-file employees have access to analyzed data, and only 15% say everyone in the organization has access?
If you are associated with analytics at your organization, whether as a producer, curator, or tool manager, this should give you pause. Technology providers and consultants have you so focused on producing more assets (reports, visualizations, dashboards – which are now often marketed as “advanced”) that everyone forgot about the other side of the equation: ensuring that what is produced is being consumed. For an analytics strategy to have the impact a company requires, it is time to stop listening to all the people trying to sell something. It is time to listen to the customer, the analytics consumer. In your organization, the analytics consumer is the campaign manager in marketing trying to improve the effectiveness of their investments, the logistics manager resolving supply chain bottlenecks, and the global finance team trying to close the quarter quicker to allow for more analysis – to name just a few.
One of our enlightened clients, Brown-Forman, recognized this issue when they weren’t getting the daily adoption they wanted after implementing Tableau. They went to the source and surveyed their internal customers. They discovered that: “Simply a lot of people didn’t know how to access information across all of our tools and platforms.” Less than 20% of their population were confident that they were aware of what current reporting was available and knew how to access it. Only 1 in 3 were satisfied with their experience of accessing business information. What was encouraging was that over 90% were open to change. So just pumping out more analytics wasn’t the answer.
So, what should organizations do to address these analytics challenges? Besides asking the customer directly (what Brown-Forman did), we see requirements fall into three broad buckets: (1) Access, (2) Awareness, and (3) Experience. We believe that together, focusing on improving these three areas for the analytics consumer can have a more significant impact than just SSA or a data literacy program.
In general, create a location (some call it a hub or portal) that can serve as the central clearinghouse for all the assets that an analytics consumer may need. This starting point includes assets produced by the main analytics team and insights captured in tools like Excel and PowerPoint. (Note: In 2021, Excel use grew by 30%).
Requirements also need to support the protection and governance programs of the organization. This means enforcing existing policies and tools but also offering a streamlined process whereby analytics consumers can request timely access to additional insights. SIDEBAR: Time is of the essence. For teams requesting access to internal data beyond their departmental remit, the response time could be measured in months in 53% of cases.
Making the analytics assets available to the respective teams is one thing. It is another if analytics consumers do not know these hubs exist or that specific assets that could improve their outcomes are added/updated. These new consumers are distributed geographically and/or by location (home, office, store, branch, operations center, warehouse, manufacturing, client location, etc.). Establishing an active awareness program, supported smart alerts, and nudge engines integrated into their existing work tools is critical for driving adoption and keeping the analytics community active. SIDEBAR: Making a wrong decision. 44% of users occasionally or frequently made a wrong decision because they did not have the information they needed.
It’s not just about delivering digitally or rolling out SSA tools to more people. Organizations must consider the analytics consumer persona more broadly. They are diverse (finance, sales, marketing, operations, customer support) and have a very different skill set (domain vs. analytical vs. technical) than the typical analyst. While data and analytics pundits push for data literacy programs to make up for some of the perceived skills gaps, the complexity of the tools and how they have been implemented may be exacerbating this problem.
To drive analytics consumption, a simple experience is paramount. It should include many elements of B2C thinking, including offering multiple ways to find the right item, whether by searching, browsing, or peer recommendations. It needs to be aesthetically pleasing to accelerate onboarding and a quick learning curve. Users should be able to provide feedback and pose questions to the producer of the report or to the broader community. Most importantly, it should allow the user to compose the analytics assets within the process context and facilitate collaboration across their extended team.
In general, your analytics program may be limited in its potential, not because of the BI tools or reports that are being provided. Rather, it is constrained by the lack of alignment with the analytics customer and how they consume the assets. Rather than making assumptions about what would be beneficial, why not just ask them what they need to be effective and stop listening to sales noise?
For over 20 years, I have immersed myself in the world of data and analytics. And during that time, data and analytics have changed. A lot. I’m sure many of you remember the days when reporting was tied to your ERP system. If you used IBM’s ERP, then naturally you used Cognos for reporting. Or if you used SAP, then you used Business Explorer or Business Objects.
But then self-service BI, analytics, and visualization tools began to emerge. And organizations shifted from a single tool reporting solution to a best-of-breed approach, where users and departments selected the tool best suited for their needs. Shadow IT emerged during this time, and their role was to enable and support these self-service tools.
As a result of the self-service evolution in BI and analytics, many organizations also embarked on a journey of business and data transformation. And they were all looking to solve the same challenges: How do I drive adoption of all these analytics tools? How can I help users find what they need quickly and trust it? And how do I ensure analytics doesn’t become an afterthought – for leadership and for end-users?
Simply put: how can I ensure that my organization is getting the most value out of our data?
Organizations made many attempts to solve these challenges. Some organizations built data warehouses, data pipelines, data lakes, data fabric, data meshes, and/or invested in data governance. And while these efforts tackled some of the core tenets of data management for data producers and consumers, the core challenge remained: are analytics reaching the consumers who need them most?
The short answer is NO. In fact, according to Gartner, most organizations focus their analytics efforts toward technologists, who make up only a small subset of the people with analytics needs in an organization. The research shows that 92% of the potential analytics consumers may be neglected when it comes to working with analytics tools and resources.
So how can organizations solve this challenge? How can they ensure that all users can find the analytics assets that they need to make informed decisions? How can you make sure that the data strategy is supported by an overarching information strategy?
This challenge certainly isn’t new. But how organizations solve this challenge needs to change. And that’s where ZenOptics comes in.
ZenOptics knows that in order for analytics consumers to make informed decisions, they need to know which report is right. That’s why we’ve designed our solutions with the analytics consumer in mind. By giving analytics consumers a simple way to determine which report is the right report, they can clear out the noise caused by numerous, similar versions of reports that pull data from disparate sources and systems. And they can gain visibility into where the report is coming from so that they can confidently choose the one they need for the task at hand. Let’s take a closer look.
ZenOptics provides a unified view of analytics assets that curates the information a user needs to accelerate decision-making. As a personalized “report catalog” delivered via a highly customizable dashboard, users can discover and access analytics content through favorites as well as within categories and workflows.

ZenOptics Dashboard Example
From reports and dashboards to Excel spreadsheets, PowerPoint presentations, and PDFs, users gain understanding through analytics metadata about these assets, allowing them to answer questions such as:
ZenOptics allows users to take discoverability to the next level through intelligence. Using keyword search capabilities, users can correlate assets through metadata, identifying traits such as the type of report (Finance vs. Sales), which system it came from (Salesforce vs. Cognos), whether the asset is certified or not, and how many users view/use the asset. Users can also discover other, related assets that exist in other systems or other parts of the organization – and if they don’t have access to the asset, they can initiate a process to request it, right from their search results.

ZenOptics Search Example
As analytics assets proliferate, another challenge facing users is redundancy. How can a user feel confident that the report they are using is the most accurate, most up-to-date version?
Because ZenOptics provides a unified view of assets regardless of the source system, users become aware of potential redundancies. Matching capabilities use algorithms to flag similar or duplicate reports based on metadata. Then, users can alert analytics producers to these potential duplicates so they can help determine which one is right or most recent. Analytics producers can then apply governance principles to certify the content at the time of curation.
This process allows business users to optimize their experience by choosing to work with only certified content (clearly identified with blue check marks), which gives them confidence that the asset they are using is right and appropriate for its intended purpose. This curated, personalized view is not only trustworthy, but also more efficient, helping users to quickly and confidently access the insights they need to drive better decision making.
Once users have a curated, unified view of relevant and appropriate assets for their work, then they can then focus on composability. By composing their own workflows, they can easily enable one-click access to the analytics assets that optimize their existing business processes. For example, finance users responsible for month-end close can compose a workflow that includes the reports, external links, internal and external apps, and database views needed throughout the month-end close process, regardless of the underlying tool in which the asset resides. By adding these analytics assets into a flow, they can easily and efficiently gather the data and insights needed to complete the process in a consistent, standardized, and efficient way.
Making use of analytics is not just about tech capabilities or processes; roles and people are key to the success of an analytics strategy. While many organizations rely on their business users and analytics producers to manage and maintain analytics assets, other organizations are finding that having an analytics business partner is key to their success. An analytics business partner understands both sides of the organization – business and technical. They help translate business needs into technical requirements and garner respect from both business and tech folks because of their ability to understand the technicalities and nuances on both sides. Because of this unique blend of skills and knowledge, they are able to work alongside analytics users to support them throughout the process – from identifying data elements through to decision making.
These analytics business partners are responsible for managing the platform, bridging the gap between business needs and increasing consumption. And they support business users as they curate content into categories and workflows within their trusted unified view.
You may find that individuals with these skills already exist within your organization. And if they do, I suggest formalizing their role. But if they don’t, consider hiring someone with a blend of functional and technical expertise to support your users.
ZenOptics recognizes the challenges that the proliferation of analytics assets has caused for organizations. Using advanced integration technologies along with machine learning and AI, ZenOptics creates an analytics catalog that brings cross-platform analytics assets together in a unified view that goes the last mile – closing the gap between insights and decisions. And when businesses adopt an analytics catalog that provides a single, unified view for enterprise analytics assets, they improve access to critical insights, increase assurance that the information is right, and accelerate decision making across the organization.
Ready to learn more? Request a demo.
Written by ZenOptics Co-Founder and Chief Technology Officer, Heena Sood.
For many people, their place of work has moved much closer. The hectic rush hour on crowded roads or on packed public transport has been replaced by a quick journey along the landing or down the garden to the home office. In due course, many will return to the previous way of working in central office locations, but it seems highly likely that the “New Normal” will be marked by more people than ever before working remotely – particularly since it has only accelerated an existing trend of enabling remote workers.
We all know that many advantages are proffered for home working, and indeed I am a great fan of doing so. Of course, there is a range of technology that helps with online meetings and other forms of office communication, but there is also a danger that matters that would have been covered in the informal interaction between colleagues in an office will be missed. We no longer have the coffee machine chats, the quick conversation with the colleague at the next desk, five minutes grabbed “on the fly” with the boss, and so forth. This impacts us all but it’s especially acute among younger and, thereby, less-experienced employees. Personally, I can vividly remember in my early career how I was rescued from several professional “faux pas” after a few wise words from a more senior colleague! Would I be so fortunate now?
I have spent most of my recent career in the analytics industry, so not surprisingly my thoughts have wandered to how this challenge might play out in that world.
Let’s imagine you are searching for a report. One obvious way of starting this process would be to see if anyone has produced anything like this before, and that may likely involve asking around your office. If you are working remotely, that informal collaboration is not so easy. In today’s data-centric world, business users were already faced with the challenge of finding reports and the necessity of trying to work out which, if any, were relevant to their needs. Now that challenge is compounded because everyone is working from different locations. Enterprise data and documents are scattered all over the virtual work ecosystem. Even once access is set up to the ecosystem from remote locations, this “virtual clutter” makes it even harder to determine who owns what data or report, particularly when business users are using different BI and analytics tools.
Report clutter kills productivity. The ability to search a catalogue of reports to identify the right reports for your needs – and reports that are similar that could provide additional insights – would save you time. If you can readily see the wheel online then you won’t need to reinvent it! And wouldn’t it be even better if the available reports were rated as to their suitability for particular purposes by appropriately qualified colleagues?
These are among the business challenges that ZenOptics can help solve, thereby dramatically improving your decision-making process – regardless of where you may be working.
Find out more about how ZenOptics makes finding the right reports at the right time easier, read our white paper “Report Management in the New Normal – A Guide for COOs.”
Many thanks to Peter McQuade, vice president of Alliances and Channels at ZenOptics, for authoring this blog.
Could you deliver even more value with the analytics assets you already have in place?
The answer for many organizations is “yes.” And a logical place to start is by enabling more people throughout your organization to make decisions based on data and analytics. It’s a relatively simple model: put more resources into the hands of people who are responsible for the majority of day-to-day decisions and your organization will be situated for amplified impact.
Yet research shows that BI and analytics typically focus heavily on tech folks. In fact, Gartner shows that most initiatives focus on dedicated technologists – ignoring up to 92% of the organization’s potential users.

Many organizations try to address this through self-service, but instituting a self-service program is not enough. These initiatives commonly open up the tools to more users – which is a great start, but extending the openness of a tool or platform does not guarantee increased use. Why? Because these tools are typically not designed for the casual user. Further, multiple tools are often required for a single purpose in order to understand the analytics and the underlying context. Organizations must consider what is necessary to not only allow these users to work with analytics, but to empower them.
In short, organizations need to see any person who has to make a business decision as a viable user of analyzed data – the analytics consumer. Only when they have a clear understanding of this new persona can they align the right resources to their needs. The result will be enabled, empowered people who are focused on business outcomes.
As a best practice, when considering how to best set someone up for success, it is important to look at things through their perspective and understand their motivations, challenges, and the way they work. Analytics consumers are not the same as data folks – they have different roles, different needs, and are focused on different business outcomes. As such, It’s important to understand the unique needs of this group. What roles are these people in? What reporting/analytics needs do they have? Who do they need to collaborate with? How quickly must they have information – and make decisions based on it?
Let’s consider some of the traits of these analytics consumers are:
Considering these traits, how do you empower this diverse set of people with requirements and skills unique to their particular business roles?
First, allow users to work with the tools that meet their needs. Different BI and analytics tools are suited for different purposes. Your finance department lives in Excel, while other people consider it a necessary evil and prefer to view and assess information visually, perhaps in Tableau. Some people prefer a dashboard overview, while others want to drill into the details and mine for finer grain insights. You can empower them by simplifying their experience and allowing them to work with what is most natural and/or appropriate for their needs.
Second, allow people to seek further understanding and context if they wish. Some people can’t – or don’t want to – take information at face value. Fundamentally, analytics consumers are a procurement person, a salesperson, or a marketing person first. They need to see the analytics organized in the context of what they are trying to do – whether it is quarter close, a new customer proposal, or generating a new campaign. Here is where they have to make decisions, and this is where analytics metadata and context come in for not only common, standardized understanding but to provide an additional level of confidence in the information. Further, if there’s a question about the report/asset, the analytics consumer should easily be able to identify who the business owner of that asset may be to reach out quickly for more detail.
Third, despite how independently people may work, they usually do not work in isolation. The analytics they discover and use will be valuable to others as well. It is important to facilitate collaboration, sharing, and easy communication surrounding each of these analytics assets – or groups of assets – to scale the impact and support the decision-making process.
Empowering people with resources is not just about technology. To truly meet the needs of your analytics consumers, you need to establish a user experience that facilitates the discovery, composition, and promotion of analytics assets in intuitive ways that align to support the way people work.
Simplify Discovery and Access of assets: Often organizations think that because an individual has permissions in a tool that he or she will have everything they need. Yet that is generally not the case. One of our customers conducted a survey of their users and found that less than 20% were confident in the available current reporting and how to access it. Just because someone has access does not mean they are able to quickly assess which underlying tool they should go to for the information they need, nor that they will be able to easily identify the appropriate analytic asset for their use. Organizations can benefit from providing a single place for trusted assets to be accessed – regardless of the underlying tool or platform – so analytics consumers can quickly find and open the report, dashboard, spreadsheet, or PDF they need to do their daily work.
Compose analytics flows: Many analytics consumers have certain recurring report-related business processes they follow. For instance, end-of-month reporting will include individual reports from different regions, divisions, etc. These consumers see the analytics in the context of the processes or flows – and these processes require multiple assets and multiple sources (tools). Creating cross-platform analytics workflows can allow these people to quickly launch the series of analytics assets they need to accomplish their work. Even if it is as simple as reports that are discussed in a weekly meeting, a workflow including all the reports – ordered in the sequence of discussion – can save time and energy. More importantly, it can ensure the team and stakeholders are all working from the same information.
Scale the impact of the analytics: Providing a simple, intuitive experience for analytics consumers, sets the stage for resources to be shared and consistently, appropriately used across teams and business units. People need to collaborate to support and substantiate their decisions. And when they need more information, they need to be able to easily search for more assets, dig into the context (the analytics metadata) of the report, and mine for further intelligence.
Ultimately, by enabling more diverse users with analytics, they will be better positioned to move your business forward. ZenOptics provides an intuitive user experience for analytics consumers to easily find and use analytics in support of their daily work. Learn how by requesting a personalized demo.
Written by ZenOptics Sr. Manager, Product Marketing. Julie Langenkamp


