ZenOptics was recognized as a Sample Vendor in Gartner® Hype Cycle™ for Data and Analytics Governance, 2026 | Learn more
The ability to quickly access and analyze information is required in today’s competitive business environment. Self-service business intelligence (BI) and analytics tools have completely transformed the way that businesses utilize data – often to great benefit. However, organizations now also have to deal with some growing challenges and issues introduced by it.
The ZenTalk with featured speaker Claudia Imhoff entitled, “What Have We Done? The Mounting Problems with Self-Service BI and Analytics Part 1 of 3,” explores the difficulties of self-service BI. We have summarized the significant takeaways in the form of four primary challenges organizations face.
One of the glaring issues organizations face is the inconsistency in data and the subsequent trust issues that arise. In many organizations, different stakeholders come to meetings armed with diverse sets of data and reports that often include conflicting data points. This inconsistency in data definitions and calculations within reports can breed skepticism and mistrust in analytics. ZenTalk speakers highlighted a real-world example where a financial services company incurred a staggering $40 million rounding error due to the use of incorrect analytics assets. Although this is a dramatic example, such mishaps underscore the need for standardization and data definition uniformity in the analytics process.
Another prevalent challenge in the realm of self-service BI is report sprawl. The ease with which modern BI tools allow users to create reports and dashboards has led to a proliferation of reports and dashboards. The issue arises when anyone, regardless of expertise or understanding of the inherent business rules in data source structure, can generate reports. The consequence? A lack of control over the quality and accuracy of these reports. Plus, other people in the organization do not know which reports or dashboards should be used for analyses and decision making.
While data governance is a priority in many organizations, the usage of data in the form of reports and dashboards requires analytics governance as a complement to data governance programs. This layer of governance ensures that the analytics assets are accurate, relevant, and in alignment with organizational goals. It’s not just about managing data; it’s about managing the entire analytics process. The absence of governance not only results in report proliferation but also contributes to unverified accuracy of reports.
Perhaps the most critical issue of self-service BI and analytics challenges are the direct impact on decision making. When analytics assets lack standardization and are riddled with inconsistencies, individuals within an organization risk making decisions based on inaccurate data. Further, with the proliferation of reports that may be similar in nature, a decision-maker may not know which report or dashboard contains the appropriate information for use. This lack of validation can lead to a fractured decision-making process. The mounting problems in self-service BI are not merely operational issues; they can significantly impact the strategic direction of organizations and, in some cases, the company’s bottom line.
The ZenTalk concludes by highlighting how critical it is to identify and resolve the issues surrounding self-service BI. Critical issues that require attention include data inconsistency, report sprawl, the necessity for analytics governance, and the possible detrimental effect on decision-making. To realize the value of data as an asset, organizations must resolve the challenges with self-service BI and analytics.
To listen to the full ZenTalk discussing these challenges, and to hear the follow-up segments on how organizations can tackle some of the issues, please click here.
The ability of management to steer their organization toward achieving success is directly dependent upon the information they have before them and their decision-making process. Having the right information at the right time requires a data and analytics ecosystem that can present accurate and timely data in an easy-to-understand manner.
A best practices approach to analyzing data is to start with highly summarized information and then investigate those areas that are outside the bounds of expectation.
Summarized information in the form of measures or Key Performance Indicators (KPIs) provide individuals with the information they need to assess performance and make informed business decisions.
Relevant information can be presented in different forms. KPIs are meaningful, predefined measures that provide individuals with the information that they need to assess previous actions. KPIs can then be compared to target performance and provide individuals with the ability to assess past performance. For example, if the goal is to improve customer satisfaction, then several KPIs can help to monitor that goal, including order cancellations, response times to customer inquiries, and customer churn.
Looking at the customer churn KPI in greater detail, the purpose of this KPI is to monitor the rate of customers who stopped being a customer. This KPI should raise several questions such as:
While KPIs present individuals with meaningful information for decision-making purposes, there are several factors that one must consider.
1. Defining the indicators of performance. KPIs can be difficult to define because the definition requires knowing what performance to measure and how to measure them. In addition, consensus from the individuals who are being evaluated based upon the KPI is critical. Without a commonly accepted definition of a KPI, it will not be accepted or used.
2. Obtaining the necessary data. Once the KPI has been defined, the necessary data needs to be acquired and curated. Depending on the complexity and number of the operational systems of the organization, this task can become quite daunting. Ideally, the information that is needed is already stored within a repository such as a data lake or data warehouse.
3. Calculating the values according to the KPI definition. Applying the business rule or calculation to a set of data in order to derive a KPI requires a clear understanding of its definition by the individual who is responsible for this task. Incorrect calculations are primarily caused by a lack of understanding.
4. Performing timely updates. The frequency at which KPIs need to be updated is important for ensuring the data is available and scheduling the calculation of the measures. Keeping the KPIs updated on a periodic or an as-needed basis is critical to providing individuals with current meaningful information for decision-making.
5. Visualizing KPIs. Data, by itself, can be overwhelming and difficult to analyze. Through visualization, graphical representations of data can highlight important aspects within the data and assist the viewer in focusing on important items within the set of data being analyzed. In certain cases, visualization of information can assist the viewer in being more efficient with his/her analysis.
6. Presentation of KPIs. When presenting KPIs in the form of a report or a series of KPIs in a dashboard, it’s important to understand logical groupings and the number of measures. Too many KPIs presented together in one form is overwhelming to most individuals, so less is more. Also, the grouping of KPIs by subject matter or ranking of importance to the viewer makes them easier to interpret.
7. Analytics Catalog and Enterprise KPIs. Establishing common enterprise-wide business definitions and KPIs for individuals within an organization to use and access is critical to supporting fact-based decision-making. An Analytics Catalog makes information available by providing business and data definitions as well as access to and discovery of KPIs, reports, and dashboards for insights and investigation.
In order to effectively make informed business decisions, individuals must be able to easily locate relevant information. Curating reports and dashboards into a single, central Analytics Catalog simplifies the ability to quickly access and view KPIs—especially when those indicators may have been created in different underlying tools or applications. By centralizing KPI access, individuals can quickly see and assess relevant and timely information so that they can make informed and ideally better decisions.
The Analytics Catalog within ZenOptics Analytics Hub centralizes reports and dashboards from across the analytics ecosystem to establish an internal KPI marketplace for an organization. Individuals can quickly and easily access enterprise KPIs, standard business definitions, and the supporting analytic assets to assess performance and further investigate what the indicators are communicating. To learn about ZenOptics Analytics Hub, please visit: https://zenoptics.com/platform.
To learn about how ZenOptics delivers a KPI marketplace for its customers, please request a demo at https://zenoptics.com/demo.
Organizations across industries face the pressing need to extract valuable insights from their data and analytics more efficiently. This is where analytics automation becomes crucial. Analytics automation is a powerful functionality to streamline the discovery and use of analytic assets (such as reports, dashboards, and visualizations) from one or multiple source systems.
In this blog, the value and capabilities of analytics automation are explained and related to the other components of an Analytics Hub, including the BI portal and analytics catalog.
ZenOptics simplifies the process of extracting and integrating analytics asset metadata into the Analytics Catalog through its smart connectors and platform.
Analytics automation incorporates AI (augmented intelligence, in this case) into the analytics catalog to provide cross-platform indexing, metadata about the analytics assets, and usage data—all in the centralized location of the ZenOptics analytics catalog.
ZenOpics then leverages machine learning algorithms and smart algorithms to identify patterns, relationships, and trends in data. This automation enables ZenOptics to generate meaningful, robust recommendations that foster greater efficiency during analyses and decision-making processes.
Most people typically know, or at least have an idea, of which analytic assets they commonly work with to conduct their business. However, they don’t always know if there is a supplementary—or perhaps even better—analytics asset that they should be using unless they have some sort of assistive intelligence helping to recommend useful information.
For example, analyzing sales results for the month of August by region provides a comparison by geography for a specific time period.
However, if the required analysis is a trend or budget comparison, then a different analytic asset is needed to obtain the knowledge and insights of the data over time. Conducting an exploratory search in the available BI tools and reporting applications to see if an analytic asset already exists is a time-consuming exercise.
Further, if you don’t have access to the analytic asset or the BI tool, you won’t know what else is available—and in those cases, you either build or request another report and thereby contribute to the report sprawl within your organization.
Analytics automation aids the discovery of enterprise analytic assets to individuals with relevant recommendations related to a search term, file name, keyword, metadata element, metric, KPI, or other term that is being viewed.
Within ZenOptics Analytics Hub, an individual can conduct a search and have a list of analytic assets compiled—both of the assets that the individual has access to and those they may not.
For those analytics assets where the individual does not have permission, they will be able to view the name of the report, the description, helpful metadata for that report, and the report owner and then be able to request access.
This functionality facilitates discovery of information that individuals may not be aware of and greatly reduces requests to build new analytic assets.
By automating repetitive and time-consuming analytical tasks, organizations can streamline their data processes and focus on critical analysis, strategic planning, and decision-making. Analytics automation offers benefits such as faster analytical analyses, enhanced accuracy, and increased agility, therefore enabling businesses to gain a competitive edge.
Analytics automation in ZenOptics workflows is the ability to bundle analytical assets from one or many different sources (e.g., BI tools) that have been integrated into the analytics hub to support a business process. For example, financial month-end closes require the reconciliation of subsidiary ledgers and systems to the main accounting system each month in order to close the financial records.
As part of the reconciliations that need to take place, comparing revenue and sales from a CRM system to revenue reported in the accounting systems requires reviewing reports from each of those systems to ensure that all of the sales transactions in the CRM system have been appropriately accounted for in the accounting system and that revenue recognition has been handled correctly. This activity requires consistency each month and utilization of the appropriate and same analytical assets that correspond to the same time period.
Within ZenOptics Analytics Hub, an Analytics Workflow is a bundle of analytical assets that have been organized, synchronized, and shared with colleagues to help facilitate analytical processes and collaboration such as a financial month-end closes, regulatory reporting, and compliance.
Utilizing analytics automation brings numerous benefits to organizations:
Increased Efficiency: Automating analytics discovery and workflows minimizes the manual tasks associated with gathering and preparing assets for business processes, therefore reducing the time and effort required to derive insights. This boosts operational efficiency and allows teams to focus on high-value analysis and decision-making.
Enhanced Accuracy and Consistency: Manual business processes are subject to human errors, but with ZenOptics, the risk of mistakes is minimized because the analytic assets are curated, defined, and certified as trusted. This ensures the use of appropriate analytic assets and the standardized application of analytical processing, thereby resulting in consistent, reliable insights.
Accelerated Time to Insights: ZenOptics streamlines the end to end analytics process, enabling organizations to obtain actionable insights faster. By automating repetitive tasks through workflows and providing intuitive collaboration and efficiency features, ZenOptics shortens the time between analytics discovery and meaningful analysis.
Improved Collaboration and Governance: ZenOptics promotes collaboration among teams by providing a centralized platform for analytics access, sharing, and collaboration. It enhances analytics governance through its analytics catalog and provides analytics discovery, certification of analytical assets, security and compliance, analytics usage statistics, and monitoring across the organization.
In the era of advanced analytics, organizations need robust solutions to automate and streamline their analytical processes effectively. ZenOptics Analytics Hub supports this need through its analytics automation functionality, which enables businesses to unlock the full potential of their data and analytics. By leveraging ZenOptics’ capabilities for analytics integration, preparation, workflow, governance, and collaboration, organizations can achieve increased efficiency, enhanced accuracy, accelerated time to insights, and improved governance and collaboration.
With ZenOptics, individuals and organizations can confidently navigate the complex data and analytics landscape and make information-driven decisions that deliver success in today’s competitive business environment.
Information-driven decision-making in today’s fast-paced business environment has become paramount for organizations seeking a competitive edge. However, the ever-increasing volume and complexity of data and analytics within an organization pose significant challenges to ensuring effective decision-making processes. A critical component of accessing the right information at the right time in a fast-paced business environment is an analytics catalog coupled with analytics governance to harness the true potential of an organization’s analytic assets (e.g., reports, dashboards, visualizations, etc.).
ZenOptics’ Analytics Hub software platform is purpose-built to establish a unified view and catalog of an organization’s enterprise analytic assets and to enable a streamlined analytics governance process to facilitate decision-making. In this blog post, we will explore the imperative of analytics governance and how ZenOptics software facilitates data-driven decision-making through effective governance practices.
Analytics governance unlocks the transformative power of information while fostering operational efficiencies and reducing organizational risk. By implementing robust governance policies, processes, and controls across the entire analytics pipeline—from the quality and accuracy of data to the discoverability and accessibility of the reports—the accuracy, consistency, and security of analytics assets, analyses, and initiatives are well supported and trusted throughout decision-making processes.
With a unified approach to governance, risks are mitigated, trust is built in data-driven insights, and value is derived and maximized from analytics investments. In addition, misinformation, redundancies of effort, and associated costs are reduced or eliminated, thereby improving financial and operational success.
Analytics governance is not without its challenges, particularly given the complex nature of legacy BI and self-service ecosystems. The proliferation of report silos, multiple BI tools, and report sprawl from self-service BI and the compounding pool of no-longer-used and unverified reports contribute to confusion, inefficiencies, and suboptimal performance with operational analytics processes.
Moreover, inconsistent business terms and KPI definitions hinder the ability to derive consistent, meaningful insights. In order to reap the benefits of governance, organizations require a comprehensive solution that can address these obstacles—not just technically but also with respect to people and process issues. This is where ZenOptics software steps in to provide a holistic solution.
The foundation of ZenOptics’ Analytics Hub is its ability to connect to various BI tools, applications, and storage systems in order to centralize analytics assets in a unified BI portal and analytics catalog where individuals can easily discover and access the information they desire. By providing a centralized analytics catalog of an enterprise’s analytic assets, search capabilities facilitate the quick discovery of information.
Individuals no longer need to log into each BI tool, application, or storage system to locate the information that they are looking for, thereby saving time and effort. Even greater value comes from the fact that visibility across tools (and the assets in each) can preemptively thwart the creation of redundant analytic assets and reduce the report sprawl that so often occurs.
Through ZenOptics, a standardized business glossary is automatically derived from the analytic assets cataloged and managed. This drives consistent understanding and interpretation of KPI definitions across the entire organization.
For example, the definitions of income, revenue, and sales are provided in a centralized manner so that everyone in the organization can understand the meaning and differences of each business term and KPI. By eliminating confusion and ambiguity, common understanding is supported, collaboration is enhanced, and confident decision-making is fostered.
ZenOptics inherits the authorizations and permissions that an organization has established within its underlying source systems so that it is not necessary to create and maintain another cumbersome security layer. ZenOptics also provides administrator views of BI tools’ report usage history such that popular reports as well as unused reports are promptly identified. With this information, unused reports can be retired and popular reports can be reviewed to ensure quality compliance requirements associated with analytics governance standards.
Ensuring the quality of analytics is paramount for reliable decision-making. ZenOptics provides a powerful analytics quality management capability through its certification process.
The process assigns stewards to review and sign off on the analytic asset according to a standardized certification checklist. The asset can then achieve a certification status, which informs individuals that the report, dashboard, or visualization has been reviewed for usability. This empowers the organization to maintain high-quality analytic assets, providing a solid foundation for making informed decisions based on accurate information.
ZenOptics simplifies compliance efforts by offering robust features such as analytics metadata, data source identification, and report/analytics certification processes. These capabilities support accountability for regulatory and audit requirements—including the analytic asset and the source of information for the asset.
Analytics governance plays a pivotal role in driving an organization’s success. ZenOptics software has emerged as a fulcrum, enabling its customers to reclaim control over their analytics initiatives. By centralizing governance processes, ensuring analytics integrity, and promoting transparency, ZenOptics empowers individuals to make timely and confident information-driven decisions.
In today’s information age, enterprises increasingly aspire to become data-driven. An astounding 83% of CEOs, according to an IDC study, strive for their organizations to become more data-informed. Yet, the path to achieving this goal is fraught with challenges. On average, large organizations face the complexity of managing 4-7 distinct BI & Analytics platforms, 129 business applications, several legacy tools, and widespread reliance on spreadsheets.1
Saurbh Khera, CEO of ZenOptics Inc., recently spoke with industry expert and author of Delivering Data Analytics, Nick Kelly, during a webinar about the top three challenges organizations encounter within the current analytics environment:
A significant issue plaguing organizations is productivity loss due to hunting for reports and information needed to do their job. Saurbh highlighted that analysts spend approximately 1.8 hours daily merely searching for data. This inefficiency translates into an annual loss of about $25 million.2
Duplication of content represents another formidable challenge. A report or analysis generated within an organization may not be easily discoverable or known to exist. When information can’t be found, users or developers will create a new one, which leads to duplicate reports and dashboards. The result is wasted time and redundancy, which can lead to significant annual losses, Saurbh noted.
Saurbh also called out the operational risk of regulation non-compliance when information is not easily discoverable, with the potential for fines if information is missing or incorrect. Non-compliance with regulatory requirements can damage an organization’s reputation and credibility apart from monetary loss.
Nick elaborated on the roadblocks that hinder the transformation into an ideal data-driven enterprise. These obstacles include poor adoption of analytics tools, perceived lack of business value from these tools, difficulties in locating and managing analytic assets, inadequate understanding of user information needs, and inconsistent standards throughout the organization.
An effective approach to overcoming analytics adoption challenges involves technology, user experience, and change management. Saurbh underscored that “providing lots of BI and analytics tools is not a strategy. It’s about using those technologies effectively and making people aware of what is available. So, the disconnect between the strategic goal of using analytics and how people are trying to do so is the most critical part.” Nick and Saurbh discussed activities that are effective in improving analytics adoption:
To increase adoption, we must strive for a user experience similar to Netflix—intuitive, personalized, and engaging. Nick advocates this approach. He said, “I’ve always been a big advocate of the single interface where you can do everything.… It’s okay to have a proliferation of BI analytics technology as long as you can unify it in a single interface.”
This strategy requires understanding the value proposition of your BI analytics tools and obtaining regular feedback and input from users. Nick added, “The core to driving analytics adoption is having a feedback loop and for analytics usage to survive, evolve, improve, and iterate.”
ZenOptics provides a software platform that addresses the challenges of analytics adoption by emphasizing the power of simplicity. By unifying cross-platform analytics assets in a single user interface, ZenOptics’ analytics catalog simplifies the discovery and use of trusted analytics assets, unlocking the value of your investments and your people.
ZenOptics simplifies discovery and governance across your entire BI analytics ecosystem. It empowers teams to compose and collaborate around their analytics workflows, enabling you to assess and optimize the impact of analytics as usage scales. This is crucial in designing a beneficial experience that drives adoption and data culture.
Reflecting on the capabilities of ZenOptics and the insights from the webinar, several vital takeaways emerge for enterprises aiming to improve their analytics adoption:
1. Create an analytics environment that is easily accessible: Providing one-stop access to all analytics resources can significantly decrease the time spent on data search, thereby enhancing productivity. The unified interface of ZenOptics exemplifies this approach.
2. Foster and facilitate analytics governance: Mitigate chaos and establish trust by instituting a system that ensures analytics integrity and compliance. The governance capabilities of ZenOptics play a pivotal role in accomplishing this.
3. Encourage collaboration and knowledge sharing: A collaborative environment fosters knowledge sharing, leading to improved business productivity, reduced duplication, and a more engaged workforce. The combined features of ZenOptics embody this principle, enabling teams to work more effectively in unison.
These key takeaways offer viable steps for organizations to address their analytics adoption challenges, demonstrating how solutions like ZenOptics can be crucial to their journey. To foster a data-driven culture, concentrate on your goals, implement effective strategies, and leverage powerful tools like ZenOptics. Contact us for a tailored demonstration of how ZenOptics can accelerate your organization’s analytics adoption.
References:
Data-driven leadership remains an aspirational goal for most organizations with only 26.5% of organizations succeeding in doing so. While organizations adopt innovative data-centric technologies to improve their business, the lack of data-driven behaviors and beliefs still limits data usage. According to an IDC report, data culture drives enterprise intelligence. Technology is not what hinders the success of organizations; it is data usage.
This could be because there are many BI tools and technologies in use across various departments, making it difficult for enterprise users to find and access the right data. “Users seek data without realizing what already exists — reaching out to six different people, searching through three to four BI tools, exchanging 12 or more messages, and spending approximately 12 hours finding the right reports,” as Heena Sood, ZenOptics Co-founder and CTO, discussed in a webinar. This kind of siloed data can lead to productivity losses of $25 million per year, $5 million per year in content duplication, and as much as $14.2 million per year in non-compliance costs.
“It’s all about how you make the right information available to the right people at the right time,” Heena elaborated. This can be done by:
By designing an analytics experience focused on drive analytics adoption, you unlock the power of your analytics and your people. At the very core of this consumable experience are discovery and access. Organizations need to empower their teams to find and use information — and to collaborate and work smarter and faster with the help of data. Further, organizations must ensure that decisions based on analytics are accurate and have positive business impacts.
The power of simplicity — or “less is more” — is the working principle on which we at ZenOptics built our Analytics Hub. Our design allows organizations to integrate cross-platform analytics into a single portal that simplifies the access, consumption, and use of analytics assets by end users and decision makers. These capabilities unlock the true value of analytics.
Sysco Canada, a ZenOptics customer, has successfully leveraged this approach and shared their success stories in this webinar.
Similar to other large organizations with multiple analytics tools, Sysco Canada, a leading foodservice distributor, faced the challenge of redundant efforts and report sprawl. Its teams would often publish similar reports using different tools and produce different results. In addition, the reports were scattered, making it challenging to identify and locate the information needed.
“It’s an interesting journey that we are in the middle of,” said Jade Hollenbeck, Director of Analytics at Sysco Canada. “What you end up with is [the identification of] a lot of duplication [of effort and reports],” Jade continued, highlighting how decentralized their organization’s information system is, causing confusion about where to search for information when needed. “We lose sight of the big picture… what is going on?” Their analytics workflow involved many people doing similar tasks, resulting in inefficient use of time, effort, and resources.
Through the use of ZenOptics’ Analytics Hub, Sysco Canada was able to simplify its analytics workflow, allowing end users to get the most out of their analytics tools and improve associate onboarding.
Jade also explained how it felt to have thousands of reports, many of which were believed to be of minimal value. With ZenOptics, he was able to identify many duplicate or outdated reports and work with subject matter experts for different areas to clean the reporting environment. The implementation of ZenOptics helped Sysco Canada to increase the awareness of reports availability and decreased time spent searching through the sprawl of reports. Overall, the implementation helped deliver the true value of their analytics.
ZenOptics’ Analytics hub is designed to unify cross-platform analytics assets in a single interface and catalog thereby simplifying the access, consumption and use of analytics assets, unlocking the value of your investments and empowering your people. With ZenOptics, you can discover, compose, and scale.
Beyond enabling end users and decision makers, ZenOptics provides report usage, TCO dashboard, report characteristics, and impact analysis — all of which help companies make the most out of their data and their analytics investments. This results in increased productivity, collaboration, manageability, and governance.
To learn more about ZenOptics Analytics hub, request a demo.
In today’s data-driven world, individuals and businesses rely heavily on analytics and data to make informed decisions and gain a competitive edge. However, managing and harnessing the vast amounts of data available can be overwhelming without the right tools. This is where ZenOptics, the leading analytics hub software, steps in.
In this blog, we will explore the reasons why ZenOptics stands out as the best analytics software in the market, empowering organizations to maximize the return on their investment in BI, analytics, and data assets.
A crucial feature of ZenOptics is its centralized analytics catalog, which acts as a BI Portal and a unified repository for all analytic assets across the organization. The analytics catalog allows users to easily search, discover, and understand available reports, visualizations, and dashboards within a single intuitive interface.
With ZenOptics, users can efficiently navigate the analytics landscape of their organization, thereby reducing the time spent on hunting for relevant information and improving functional processes for analysis and decision-making.
ZenOptics excels in supporting an analytics governance framework, ensuring analytics integrity, security, and compliance. With a customizable certification process, organizations can validate and certify the integrity of each analytic asset from its data sources to the business presentation layer of the report. The software enables efficient analytics usage tracking, Key Performance Indicator (KPI) management, and certification of analytic assets.
These capabilities increase user trust and confidence in the accuracy and reliability of analytics and data to make informed business decisions.
ZenOptics facilitates seamless collaboration among business users, analysts, and information stewards. The software provides a user-friendly interface for discussions, feedback, ratings, and knowledge sharing. This collaborative environment enhances team productivity, promotes analytic asset literacy, and encourages cross-functional insights while fostering an information-driven culture within organizations.
Understanding the data sources and impact of analytic assets is critical for ensuring analytics accuracy and for effectively managing changes. ZenOptics automates the process of identifying redundant reports by comparing the source and metadata. This functionality also enables impact analysis, allowing users to assess the potential consequences of changes to data sources or reports, ensuring confident decision-making.
ZenOptics leverages machine learning and advanced algorithms to provide intelligent analytics discovery capabilities. The software recommends relevant reports and visualizations based on user preferences, usage patterns, and contextual information. This drives analytics exploration, empowering users to quickly find valuable insights and make information-driven decisions without the need for manual search or creating another redundant report.
Recognizing the need for seamless integration with existing systems, ZenOptics offers flexible options. It easily works with popular business intelligence tools, data visualization platforms, and embedded analytic applications. This interoperability allows enterprises to leverage their existing investments while maximizing the value of ZenOptics as its analytics hub software.
ZenOptics is the top choice for organizations seeking a solution that combines governance, centralized analytics cataloging, collaboration, automated analysis, intelligent content discovery, and automated integration. With ZenOptics, you can streamline business processes, improve confident decision-making, and receive value from your analytics and data assets.
Stay ahead of your competition and become the industry market leader with ZenOptics, the enabler of business productivity and confident and timely business decisions.
The understanding and interpretation of data is not always self-evident. Analytics assets such as reports, dashboards, and visualizations require at least a basic level of data and analysis skills as well as some understanding of the content in order to properly interpret the information and make decisions.
When people have questions about the content within an asset, they usually turn to their immediate colleagues, the report producer, or the owner to seek answers. Yet all too often, the same questions keep arising, or there becomes a pattern of misunderstanding, perhaps because people forget the answers to their questions, or they don’t understand them in the first place. This creates inefficiencies and adversely affects productivity and decision-making, which are hidden costs that compound with the growth of an organization.
Establishing a process of collaboration that documents the communications helps prevent recurring questions and creates efficiencies over time. According to Gartner, “Collecting different perspectives on data to establish a cohesive understanding is critical for decision-making. Data and analytics leaders must introduce collaboration capabilities to achieve analytics democratization.” (1)
When people share an analytics asset, they often do so by attaching the document to an email, providing a link in an email message, or uploading the asset to a collaboration tool such as Slack. Often a thread of communication is created when people ask questions or share insights about the analytics assets.
While the communication and collaboration may be meaningful, the analytics asset becomes nested and buried in the thread of responses. Also, recalling the communication based on a particular analytics asset is an exercise in remembering the topic and then searching and hunting for the information that you are seeking.
These methods prioritize communication and not the analytics asset.

Unlike email or collaboration tools where the focus is on communication and the analytics asset is an artifact that gets buried in the thread of responses, analytics collaboration through an Analytics Hub prioritizes the analytics asset and combines the communication threads.
Designed to increase the contextual value of each analytics asset, the Analytics Hub creates a unified view of all the assets and their associated metadata—including comments and other collaborative properties. The focal point is the analytics asset itself, and individuals can increase the understanding and value of that asset by rating it, posting comments, and providing feedback.
In this manner, the important discussions and context about the analytics asset are captured and are easily accessible whenever a particular analytics asset is viewed. (For more information on Analytics Hub components including collaboration, analytics catalog, and BI Portal, read “Analytics Hub: A Single Source for Trusted Enterprise Analytics Assets.”)
“Collaboration is about the application of collaborative capabilities to analytics workstreams for organizations that want to provide an environment where a broad spectrum of users can simultaneously co-produce an analytics project, bringing insights into action,” according to Gartner. (2)
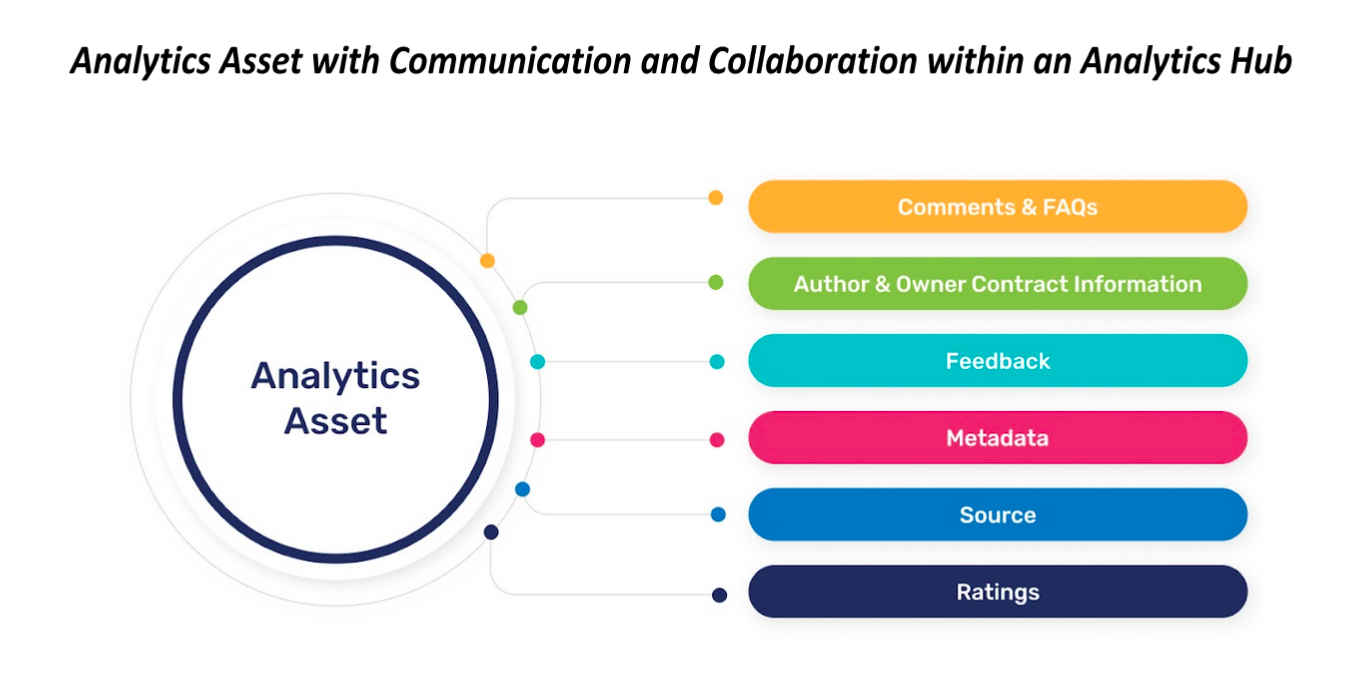
1. Increased Understanding: While each analytics asset has a name, the name by itself is typically not descriptive enough to provide anyone with an understanding of the content. Further, additional contextual information rarely accompanies the asset to describe the content, relevant business rules, metadata, parameters for appropriate use of the information, and business owner or subject matter expert.
For example, in looking at a report called “Sales by Customer,” one would think it would be a listing of customers and the corresponding sales that were made to each customer. Upon further thought, one may have questions such as:
In an analytics hub, this information can be provided and connected with the report itself, eliminating the need for each viewer to wonder and seek answers to the same set of questions. Any subsequent questions can collaboratively be explored (asked, pondered, and answered) and preserved alongside the asset. This yields greater clarity and understanding for everyone who views that analytics asset.
2. Improved Analysis: Analytics collaboration functionality within an analytics hub provides individuals an understanding of the content and associated business rules related to an analytics asset and gives them the ability to then determine how best to use the information.
Using the same prior example, if the “Sales by Customer” report contains data that is sourced from the organization’s accounting system, it will contain information that will also be reflected in financial reports used by management. If there is another report called “Customer Sales” that is sourced from the organization’s sales force automation (SFA) system, it will contain information that the sales group uses to track customer sales.
However, the definition of a sale may be different between the accounting and the SFA systems. The accounting system will recognize a sale when there is a fully signed agreement and the product or service has been delivered. The sales force automation system will recognize a sale when there is a fully signed agreement, regardless of whether or not the product or service has been delivered. The difference can be significant.
Knowing the difference between “Sales by Customer” and “Customer Sales” reports will improve analysis because there is a greater understanding of the content that is being examined.
3. Better Decision-Making: Making the best possible decision rests with the information that is being used. If one does not have a full understanding of the information being examined, then the analysis will be off. If the analysis is off, the best possible decision may not be made. So, producing better decisions requires an understanding of the information being examined—which includes the context of the data, the business rules being applied, the source of the data, and the perspectives of other individuals who have used the analytics asset. With a greater understanding of the information, the analyses are improved because individuals have an appropriate contextual appreciation for data within the analytics asset and how it should be best used.
The ability to share understanding and perspectives helps to provide context to the information that is being examined. Analytics collaboration facilitates the ability to provide understanding by gathering ratings, feedback, comments, metadata, sourcing, and other relevant information and combining it with each analytics asset within an analytics hub. Preserving this contextual information alongside the asset allows consistency and efficiency in analysis—without having to rehash questions that have already been addressed.
As a result, analysis, interpretation, and decision-making are improved because an increased level of common understanding is easily delivered and accessible.
References:
1) Sun, J., Pidsley D, (2 September 2022 – ID G00759403) Innovation Insight: Analytics Collaboration (Gartner Inc.)
2) Sun, J., Quinn, K., Pidsley, D., O’Callaghan, G., Ganeshan, A., Long, C., Schulte, W., Popa, A., Macari, E., Fei, F., Schlegel, K., Misclaus, R., Antelmi, J., (17 April 2023 – ID G00772210) Critical Capabilities for Analytics and Business Intelligence Platforms (Gartner Inc.)
In today’s fast-paced business world, having instant access to reliable and accurate data is essential for making informed decisions. However, finding the right information can be daunting, especially when it’s buried under a mountain of reports and dashboards from various systems.
Adopting the principle of “less is more” to reduce report duplication and unused or outdated reports can empower organizations to make data-driven decisions with greater accuracy and speed, giving them a competitive edge. On the other hand, an overwhelming abundance of unorganized and unverified analytical assets can hinder access to the information needed, exacerbating confusion and complexity.
Like many organizations, Illumina, a global biotech company, faced these same issues. In a recent ZenOptics webinar, Obay Mouradi, Illumina’s senior manager of Data Informatics, discussed their strategic approach to resolving the analytics challenges their organization faced, which largely resulted from report clutter and reporting sprawl. Illumina also shared how they simplified access to trusted reports and dashboards with ZenOptics Analytics Hub.
“[We] are a global company with several sites around [the world] in all different kinds of time zones in Europe, Asia, and North America,” said Mouradi. “We’re hyper-decentralized in terms of our analytics,” said Mouradi. “[There are over] 100 people building Tableau reports across 50 different areas of the business. So there’s this concept of, ‘Do I know what my neighbor’s doing?’”
As a result, employees who needed information had difficulty finding and trusting the reports, dashboards, and visualizations available. Mouradi also said that his organization experienced challenges associated with siloed reporting.
“That’s something we’ve definitely experienced,” he said. “Even our executive leadership sometimes [had] to shoot out many emails to try to get the data they need. And those emails get forwarded and forwarded and forwarded, which leads to a lot of [inefficiencies]. And when you do get the data, how do you know you can trust it?”
Mouradi said that ZenOptics Analytics Hub provided Illumina with a single interface and capabilities that helped them streamline their reporting environment by eliminating outdated or unneeded reports and centralizing trusted reports and dashboards to simplify discovery and access for users.
Mouradi stated that before working with ZenOptics, they developed a Center of Excellence (COE) to break down organizational information silos. He mentioned that one of the COE’s main goals was to integrate data from many platforms and business functions into one place. Users can categorize reports, browse them by business function, and quickly find certified key reports. He went on to say that this entailed creating a methodology and standardizing it globally.
“So that way, we can get the best information,” Mouradi said.
Aside from centralization, Mouradi said that automation was just as crucial. “When people add new reports, it’s a huge problem for us to try to sustain a catalog,” he said.
He said that ZenOptics gave them the centralization and automation they needed to identify and sunset the duplicate or unneeded reports in their source systems, which made it easier for users to find the information they required to make decisions. According to Mouradi, the feedback from their employees and leadership has been overwhelmingly positive, with one VP calling it a “dream come true.”
Mouradi went on to say that the ZenOptics software implementation and customer success teams assisted the Illumina team with guidance and best practices to reduce report clutter, thereby only retaining critical reports that executives most cared about and that supported business goals.
“Leaders can get to the information they need in a much more efficient way [through the use of ZenOptics Analytics Hub] rather than just emailing a whole bunch of people. trying to just dig around, or having 100 bookmarks,” Mouradi said.
By centralizing analytics and automating catalog maintenance, Illumina reduced the number of reports from thousands to hundreds. This ensured key reports were easily accessible and in line with their business needs and objectives.
Report clutter and tool sprawl are major obstacles to finding reliable information quickly for organizations across all industries. An analytics hub that eliminates clutter and simplifies access to trusted reports and dashboards can address these challenges.
ZenOptics offers an analytics hub platform that helps organizations achieve the full potential of their analytics assets and the people using them.
To have a first-hand look at how the ZenOptics Analytics Hub functions, kindly register for a personalized demo through this link.
The proliferation of self-service business intelligence (BI), embedded analytics, advanced analytics, and other software technologies that provide analytics are commonplace in organizations large and small. Yet many individuals within these organizations struggle to understand what analytics are available, where they can be found, and what information they provide.
To address these needs, analytics catalog technology was created to compile a listing of analytic assets that are rendered or made available via a BI Portal. Behind the scenes of the technology, an analytics catalog captures and stores the metadata about each of the analytic assets to provide standardization and additional context for consumers of the information.
Not all digital documents within an organization are analytics assets. For example, a single-purpose document, such as an employee expense report for the month of November or an October customer purchase order, is static and stored as supporting information in the accounting system of an organization.
An analytics asset is a structured report, dashboard, or visualization that provides information from a data repository. For example, a customer report may list the customer names and the amount of revenue generated for a specific time period. The customer report could be run to display information for the month of October (or whatever time period is desired).
The advent of self-service BI unleashed the ability for anyone with access to the business information to create analytics assets—rather than relying on someone from IT for assistance to build a report or dashboard. While IT no longer was a “bottleneck” for these resources, the discipline of consistently substantiating and validating the accuracy of an analytics asset was lost; this was the trade-off of embracing self-service BI—a challenge that we still grapple with today.
It is not uncommon for organizations to have multiple BI tools and applications that serve as best-in-class technology for rendering information in a meaningful manner. While it is a best practice to deploy the appropriate technology for a specific purpose, each tool, application, and platform contains a tremendous quantity of analytics assets available for use.
Many organizations that we work with have thousands to tens of thousands of analytics assets that have been created as a direct result of self-service BI and that exist in a variety of underlying sources. Yet self-service also introduces challenges. If an individual can’t find exactly what they looking for, they simply create a new one—one that may be a duplicate (or very similar).
An additional challenge is that, in many cases, analytics assets have the same name with different content or different names with the same content. In either case, figuring out which analytics asset to use and trust is challenging and time-consuming.
For example, an analytics asset named “Revenue Report” may display gross revenue, net revenue that is gross revenue less discounts, or some other variation. Unless there is a good description of the report and the identification of the business owner who can be contacted with questions, trying to figure out if the revenue displayed is gross, net, or something else is an exercise in frustration.
The purpose of an analytics catalog is to address these types of challenges. A best practice for implementing an analytics catalog is to curate the assets before publishing them within the analytics catalog. The process of curating is applying a discipline of reviewing each analytics asset and ensuring that the:
The exercise of curating analytics assets is also a critical component of an analytics governance program that ensures decision-making and analysis are performed using trusted and certified assets.
Once analytics assets have been curated, the next step is for the items to be organized in a manner that is intuitive and useful for individuals to search and discover. A best practice is to create a process of organizing analytics assets by subject matter, business function, business unit, legal entity, or whatever systematic structure that is meaningful to your organization. Organizing analytics assets provides a structure for access, context, and usage.
After an overarching structure of the organization has been defined, the next step is to create categories within the analytics catalog. For example, if an enterprise software company wants to organize its analytics assets by business function then its categories would be:
Creating categories and then subcategories classifies analytics assets in a meaningful manner for individuals needing that information.
The curation, organization, and categorization of analytics assets in an analytics catalog facilitates the discovery and usage of trusted analytics assets that are available for business users and provides information about where they are sourced or produced as well as the business and technical definition. An analytics catalog combined with a BI Portal establishes a single interface for users to access enterprise analytics assets and search by name, category, content, and/or metadata. As a result, individuals can discover the analytics assets that they have access to as well as those that they don’t have security permission. In those cases of non-access, users can request permissions directly within the tool, and a steward (or organizational role) will assess the appropriateness of the request.
The combination of a BI Portal with an analytics catalog lays the foundation of an Analytics Hub that ultimately provides increased usage of BI; greater efficiency, productivity, and confidence in working with analytics assets; and improved decision-making capabilities.
Read our Brown-Forman customer case study to learn about their journey and benefits, both qualitative and quantitative, in implementing ZenOptics. To learn about the comprehensive benefits of Analytics Hubs in driving value from analytics investments, please visit Resources.