ZenOptics was recognized as a Sample Vendor in Gartner® Hype Cycle™ for Data and Analytics Governance, 2026 | Learn more
PwC’s 29th Global CEO Survey of 4,454 business leaders across 95 countries found that 56% of CEOs report no significant financial benefit from AI: no higher revenues and no lower costs. The diagnoses in circulation focus on technology selection, talent gaps, and integration complexity. Those are real factors. The one missing from most AI ROI analyses: the analytics estate those AI systems read from is ungoverned, and that governance deficit is generating costs that no one is currently measuring.
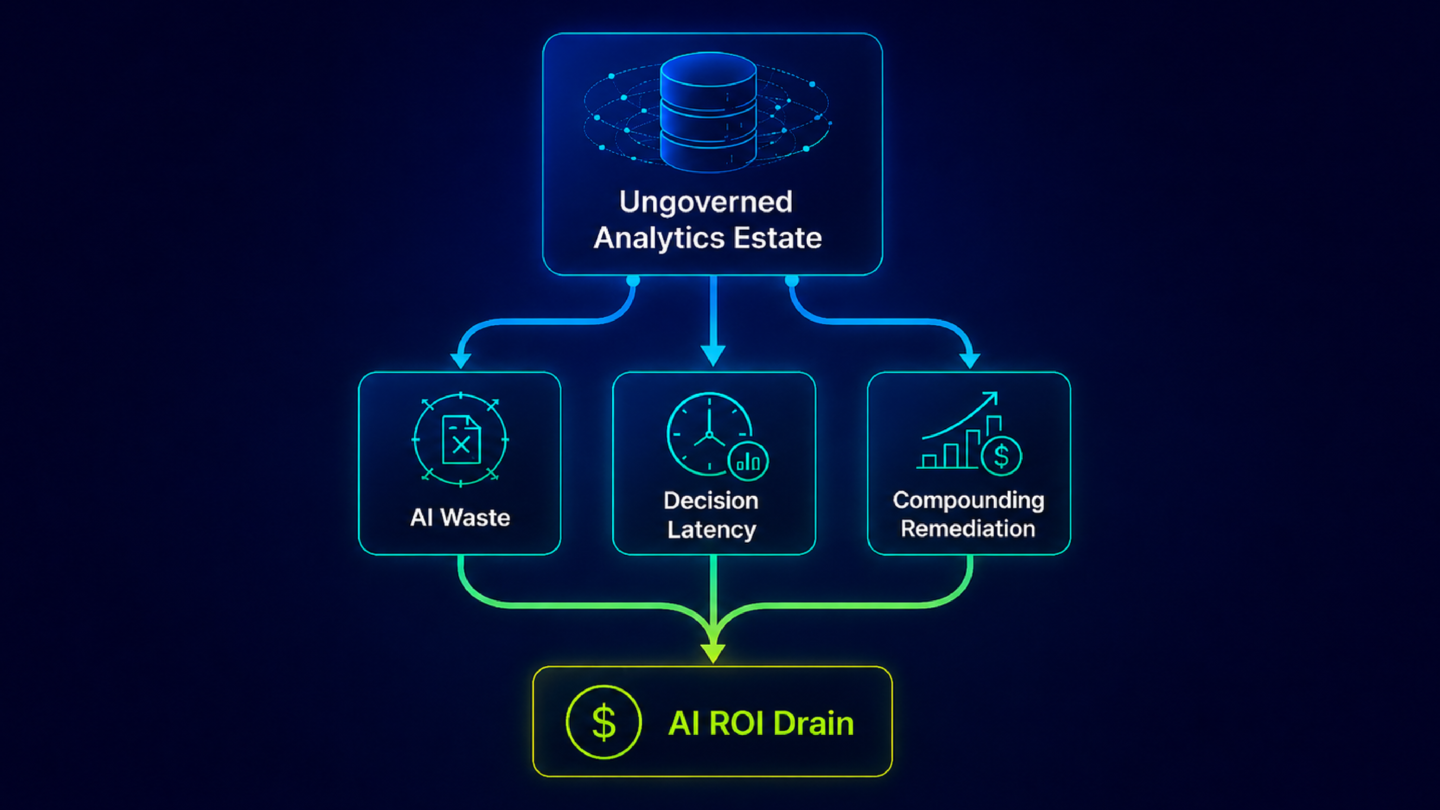
An ungoverned analytics estate does not produce a single large, visible failure. It produces three cost categories that accumulate across every AI deployment: AI waste, decision latency, and the compounding cost of a governance deficit allowed to grow. None of these appear on a governance program’s cost center. All of them show up in AI ROI.
The standard diagnosis of AI ROI failure runs along predictable lines: the models are not trained on enough relevant data, the tools are not integrated deeply enough into workflows, the workforce does not have the skills to use AI outputs effectively, or leadership alignment is insufficient to drive adoption. These are legitimate explanations for some AI failures.
AI copilots deployed into an enterprise produce inconsistent, conflicting answers to the same business questions, even when the underlying data is clean, the integration is working, and the workforce is trained. That is the pattern those diagnoses leave unexplained. And analytics leaders recognize it immediately. The investigation in these cases consistently traces back to the same layer: the reports, dashboards, and certified metrics the AI reads from. That layer is ungoverned.
As established in AI Agents Don’t Read Data Warehouses. They Read Analytics Estates., enterprise AI copilots and agents do not query raw data. They read from the analytics estate: the reports, dashboards, KPI definitions, and certified metrics that sit above the data. Standard AI readiness assessments do not assess this layer. The governance deficit accumulates there untracked, and so does its cost.
Consider a revenue operations leader who asks an AI copilot: “What is our pipeline coverage ratio this quarter?” The copilot reads from whatever pipeline report or metric definition it can locate in the analytics estate. If the estate contains three pipeline coverage reports (one from the CRM team, one from finance reconciliation, one from the sales ops dashboard) with different definitions of “qualified pipeline,” the copilot returns the one it finds first.
The number is plausible. It is also unverified. The revenue operations leader cannot act on it without first determining which report the AI used and whether that report’s definition matches the one leadership has approved. That reconciliation takes time. It happens on every AI-generated output that touches an uncertified metric. At the scale of an enterprise with multiple AI copilots running across revenue, finance, and supply chain, this is not occasional overhead. It is structural waste embedded in the AI deployment itself.
This is the AI waste cost: the gap between what an AI investment should be delivering and what it actually delivers when the analytics estate it reads from lacks certification coverage. The PwC finding that 56% of CEOs see no financial benefit from AI is not entirely explained by this gap. A significant portion of enterprise AI ROI failure lives here, in the reconciliation loop that follows every uncertified AI output.
Every organization with metric governance gaps runs a version of the same meeting.
A finance leader enters a quarterly review with one gross margin figure. A regional VP enters with a different one. Both numbers come from the same underlying data. They differ because one report excludes a cost category the other includes, and neither report carries a certified definition that resolves the conflict. The meeting cannot close on any decision that depends on gross margin until someone goes back to source, finds the discrepancy, and confirms which calculation is the approved one. That investigation takes days. The decision waits.
This pattern does not announce itself as a governance cost. It surfaces as “the meeting ran long” or “we needed more time to align on the numbers.” At enterprise scale, across a leadership calendar of quarterly reviews, board preparations, planning cycles, and operational check-ins, the time consumed reconciling conflicting metrics before decisions can be made is substantial. It does not appear on any cost center. It does not show up in AI ROI metrics. It is the invisible tax that metric governance gaps impose on every cross-functional decision that depends on shared numbers. Most analytics leaders, when pressed, can name the specific meeting they are thinking of right now.
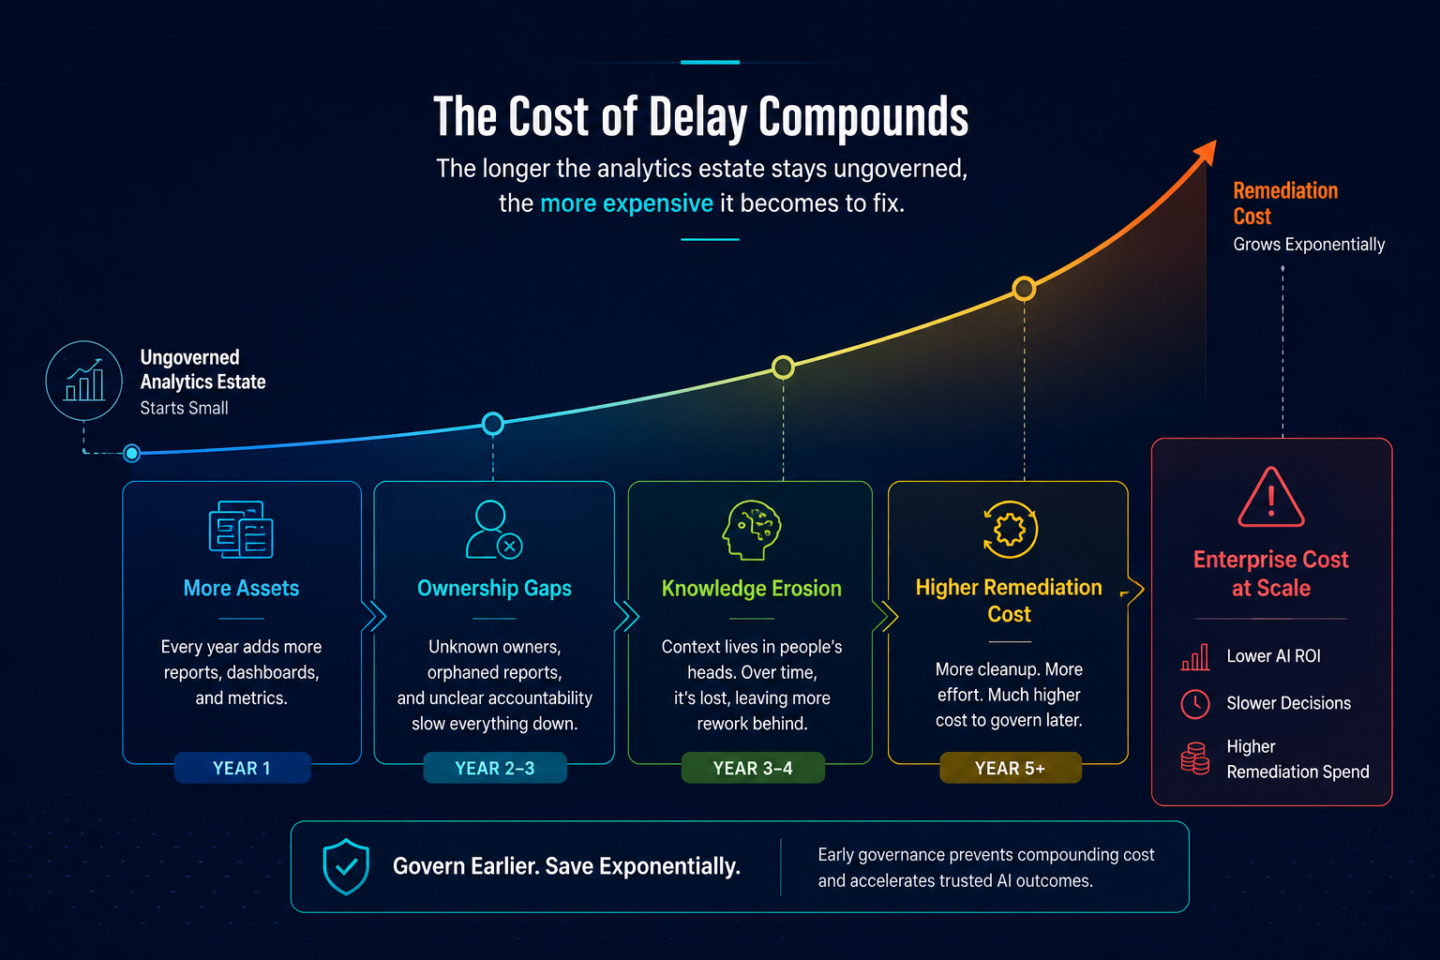
Governing an analytics estate that has grown ungoverned for three to five years costs significantly more than governing it progressively. Three factors drive this compounding.
Asset volume. Every year without governance adds more reports, more metric variants, and more BI tools to the inventory. An estate that accumulates 12,000 reports before governance begins is not simply four times harder to govern than an estate of 3,000. It is harder to triage, harder to selectively certify, and harder to deduplicate because the relationships between variants have become difficult to trace.
Ownership gaps. Metric definitions and report ownership are tied to the people who built them. When those people move on, the definitions remain but the owners do not. An estate governed years after initial deployment will have substantial portions where no current employee knows why a specific metric was calculated the way it was, what it was supposed to include, or which downstream reports depend on it. Reassigning ownership is possible. Reconstructing intent is often not.
Encoded knowledge erosion. Metric relationships (how gross margin connects to revenue mix, how pipeline coverage connects to forecast accuracy) are typically held informally by senior analysts who have been at the organization long enough to just know. Every year without encoding these relationships in machine-readable form increases the risk that the knowledge is lost before it can be captured. The analytics context layer that AI agents need to follow business logic rather than approximate it becomes harder and more expensive to reconstruct from partial information. This is the hardest governance gap to quantify before it becomes urgent. It is also the one organizations most consistently underestimate.
The remediation cost is not a one-time event. It is a curve that steepens with every year of delay. An analytics estate left ungoverned in 2024 is more expensive to govern in 2026 than it was in 2024, and the AI systems feeding from it are generating costs in the interim.
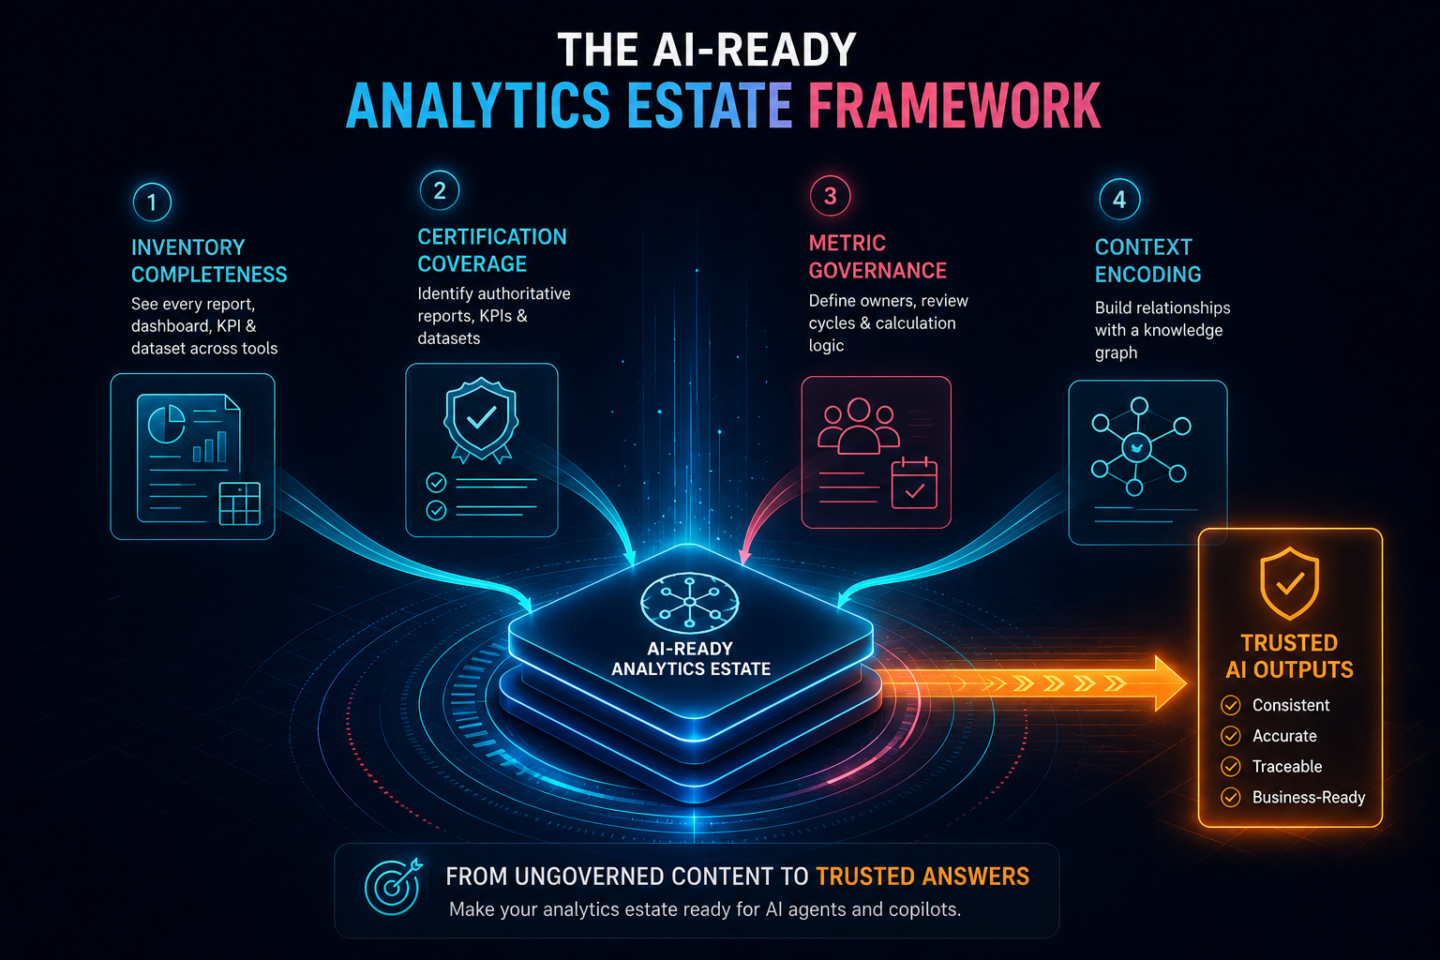
The three cost categories above (AI waste, decision latency, and compounding remediation) each trace back to the same four governance gaps in the analytics estate: Inventory Completeness, Certification Coverage, Metric Governance, and Context Encoding. Each gap has a starting point that does not require rebuilding the estate from scratch.
Inventory comes first. Certification coverage without a complete inventory is partial by definition: you can only certify assets you can see. Most enterprises running multiple BI tools have four partial, disconnected catalogs rather than one unified view. Atlas addresses this through 100+ Smart Connectors, building a continuous, cross-tool inventory of every active report and dashboard across Power BI, Tableau, SAP BO, Qlik, and others, with certification status, metric ownership, and review cadence tracked continuously. The estate becomes visible before governance begins.
Context encoding follows the estate. Building a machine-readable context layer before the underlying estate is certified and governed produces a context layer that reflects the estate’s disorder rather than the business’s logic. Nexus derives the analytics context layer automatically from the governed estate Atlas produces. Metric relationships, definitions, and business logic are encoded from existing BI metadata without requiring manual semantic mapping or a rebuild from scratch.
Organizations that bring their analytics estate under governance with this approach typically see a 20–40% improvement in analytics discovery speed and a 30–40% reduction in duplicate reports. The compounding costs described above (AI waste, decision latency, and the remediation curve) begin to close. Neither outcome happens overnight; metric governance in particular requires sustained organizational commitment that the technology supports but does not replace.
The self-assessment for all four dimensions is in The AI Readiness Checklist Every Analytics Leader Should Complete.
Is the cost of an ungoverned analytics estate the same as the cost of analytics sprawl?
No. Analytics sprawl refers to volume-based costs: duplicate reports, licensing overhead from redundant BI tools, orphaned assets, and the labor cost of rebuilding reports that already exist. The cost of an ungoverned analytics estate is distinct: it is not about volume but about governance deficit. An estate can have a manageable number of reports and still carry high costs from low certification coverage, undefined metric ownership, missing context encoding, and incomplete cross-tool inventory. The two cost categories overlap only in that both are addressed by governing the analytics estate. The root causes and cost mechanisms are different.
How does an ungoverned analytics estate affect AI ROI specifically?
Enterprise AI copilots and agents read from the analytics estate: the reports, dashboards, and certified metrics that sit above the data. When that estate has low certification coverage, conflicting metric definitions, or incomplete inventory, AI produces outputs that require manual reconciliation before they can be acted on. That reconciliation loop is the AI waste cost: AI generating work rather than reducing it. For the 56% of CEOs in PwC’s 2026 survey who report no significant financial benefit from AI, a meaningful portion of that ROI gap traces to the analytics layer AI is reading from. The full architectural explanation is in AI Agents Don’t Read Data Warehouses. They Read Analytics Estates.
What is the most expensive governance gap to leave unaddressed?
For enterprises with active AI deployments, certification coverage carries the highest near-term cost. Without machine-readable certification status on analytics assets, AI agents have no signal to distinguish an authoritative metric from an outdated or incorrect one. They surface whichever they locate first. The reconciliation cost follows every decision that depends on those outputs. Over the medium term, metric governance becomes the highest-cost gap: calculation logic changes without certification updates, and teams operate on different definitions of the same KPI without knowing it. Metric drift compounds silently until a decision depends on a metric that two teams calculate differently.
How long does it take to govern an ungoverned analytics estate?
The starting point, a complete current cross-tool inventory, typically surfaces significantly more active analytics assets than single-tool catalogs show. The four dimensions build sequentially: inventory before certification, certification before context encoding. The timeline depends on the estate’s current size and the number of BI tools in use. Atlas builds the cross-tool inventory automatically through Smart Connectors, reducing time-to-inventory substantially compared to manual audit approaches. The path to a governed, AI-ready analytics estate is measured in months, not years, when the starting point is automated inventory rather than manual catalog construction.
Where should an organization start when the estate is already ungoverned?
Start with Inventory Completeness. Certification, metric governance, and context encoding all require a complete, current view of the estate to be meaningful. Without cross-tool inventory, governance programs certify only what they can see, which is typically a fraction of the full estate. From a complete inventory, prioritize certification coverage for the metrics that AI copilots are currently querying most frequently. Those are the assets generating the highest AI waste cost today. The full sequencing guidance is in Your Analytics Estate Isn’t AI Ready. Here’s How to Fix It.
Most enterprise AI readiness programs rest on one assumption: the AI queries the data warehouse, and better data means better AI answers. That assumption held for one era of enterprise AI. It does not hold for the AI copilots and agents most enterprises are deploying in 2026. Those systems do not query the data warehouse. They read from the analytics estate. The difference explains why most enterprise AI deployments underperform even when the underlying data is clean.
THE MENTAL MODEL MOST ANALYTICS LEADERS ARE WORKING WITH
When enterprise AI investments started scaling, the dominant enterprise AI pattern was training and deploying machine learning models on data in warehouses, lakes, and databases. That made data the direct input to AI. Improving data quality, building better pipelines, and governing data at the warehouse level translated directly into better model outputs. The investment logic was sound (and it still is, for the data layer it addresses): cleaner data produces more reliable models.
That model shaped how analytics leaders think about AI readiness. Most readiness programs assess data quality, pipeline governance, lineage documentation, and infrastructure: the conditions that need to be in place before AI can be built on data. Most organizations have invested significantly here, and many have strong data foundations to show for it.
The problem is that this mental model does not describe how most enterprise AI works in 2026.
WHAT ENTERPRISE AI AGENTS ACTUALLY DO
Consider a supply chain leader who asks an AI agent: “Which of our suppliers are at risk this quarter?” The agent does not write a query against the raw supply chain database. It reads from whatever supplier risk report or KPI dashboard it can find in the organization’s analytics estate: the certified reports, dashboards, and metric definitions that sit above the data and represent how the business measures itself.
If that supplier risk report is outdated, or if there are three conflicting versions across different BI tools with no certified source of truth, the agent returns whichever it locates first. The underlying database may be current and well-maintained. The analytics layer is not. The agent reads from the layer it can reach, and that layer is the analytics estate.
This architecture applies across the most common enterprise AI deployment pattern in 2026: copilots and agents answering business questions from existing analytics. When a finance leader asks an AI copilot about gross margin by region, the copilot reads from whatever gross margin report or metric definition it can locate in the available analytics assets. When a revenue operations leader asks an AI agent about pipeline coverage, the agent reads from pipeline reports and certified metrics. In each case, the direct input to AI is not raw data. It is the analytics estate.
WHY THE ANALYTICS LAYER AND THE DATA LAYER ARE NOT THE SAME PROBLEM
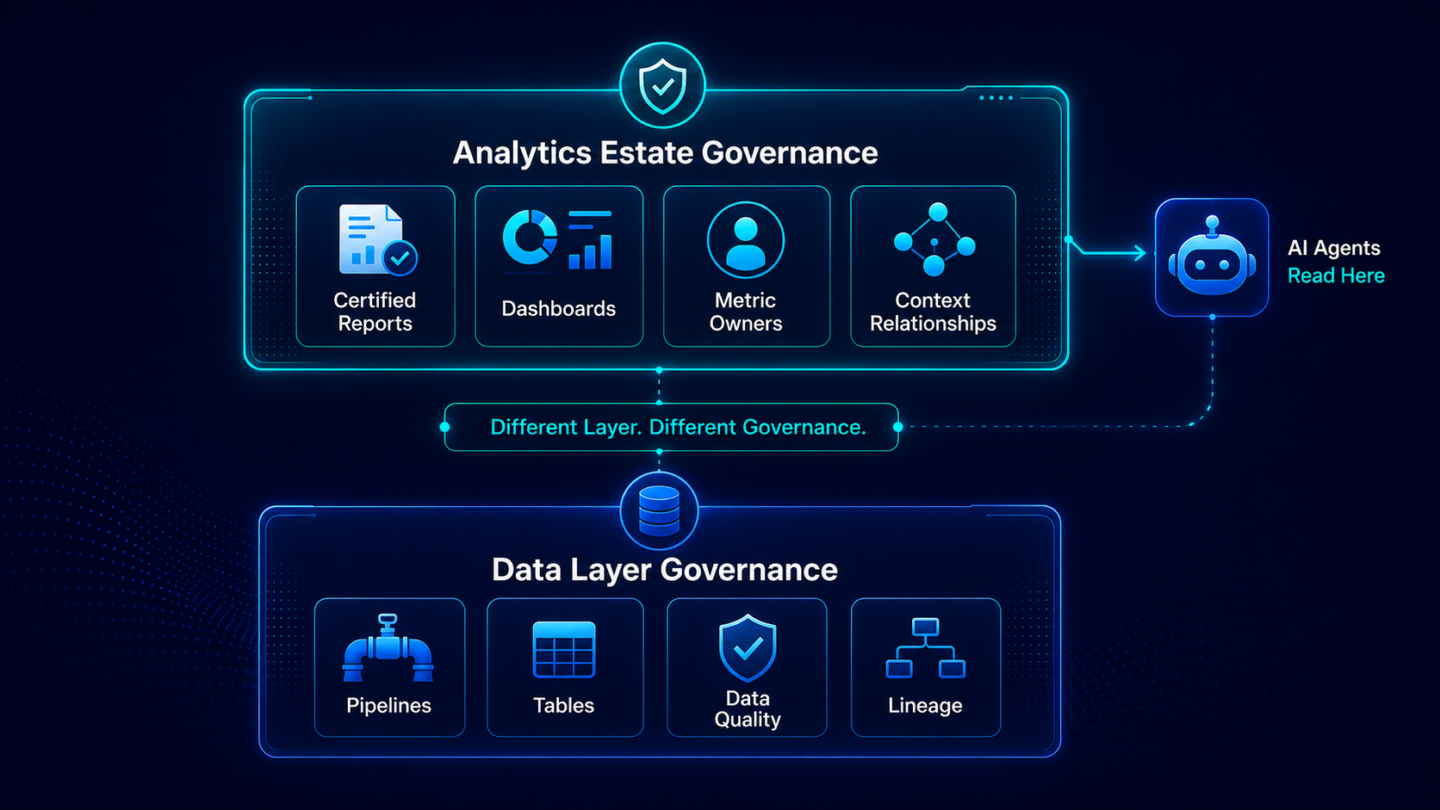
This distinction matters because the data layer and the analytics estate are governed differently, owned by different people, and fail in different ways.
Data governance programs address the data layer: whether pipelines are documented, whether data tables have defined owners, whether quality thresholds are enforced. The people responsible are data engineers, data platform leaders, and data governance teams. The failure modes are data quality issues, lineage gaps, and stale pipelines.
Analytics estate governance addresses a different layer: whether reports and dashboards are certified as authoritative, whether every active metric has a documented definition and a current owner, and whether the full estate is inventoried across every BI tool in use (Power BI, Tableau, SAP BO, Qlik, and others). The people responsible are analytics and BI leaders, metric owners, and data leaders. The failure modes are duplicate reports, uncertified metrics, and fragmented inventories. Metric relationships (how gross margin connects to revenue mix, how pipeline coverage connects to forecast accuracy) are typically encoded nowhere in machine-readable form. They exist in the heads of senior analysts who have been at the organization long enough to just know.
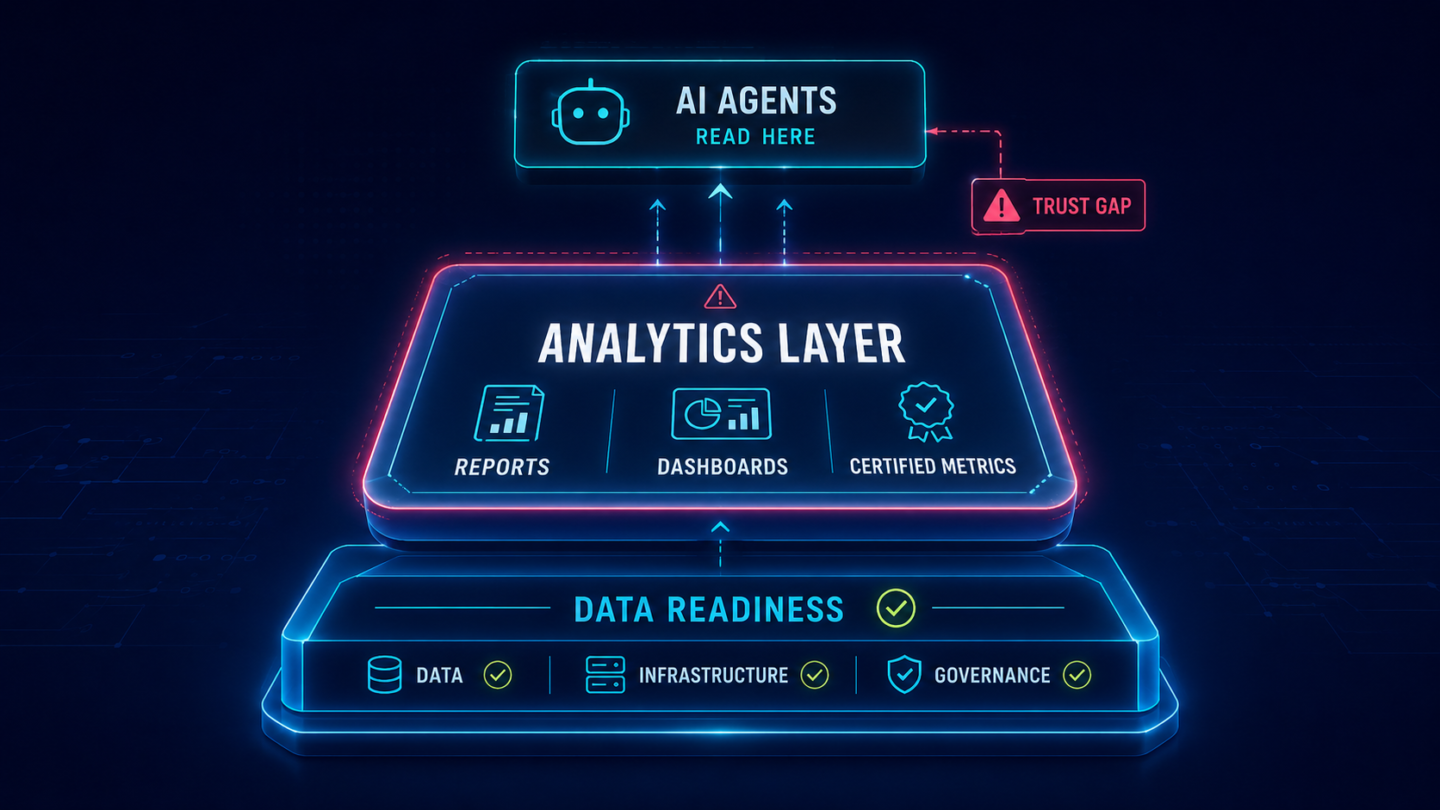
Clean data feeding an ungoverned analytics estate produces the same inconsistent AI outputs as dirty data. The failure point shifts up a layer. An organization can have a strong data foundation and still see its AI copilots returning conflicting answers, because the problem is not the data. It is the layer the AI is actually reading from.
WHAT THIS CHANGES ABOUT AI READINESS
If enterprise AI agents read from the analytics estate, then analytics estate readiness is not a sub-category of data readiness. It is a separate, additive assessment.
An organization can score well on every dimension of a standard AI readiness assessment (data quality, pipeline governance, infrastructure, talent, leadership alignment) and then deploy AI copilots into an analytics estate that is entirely unprepared to be read. The standard assessment did not assess the layer that is failing, because standard frameworks were built for a different architecture of enterprise AI. The full analysis is in Why Most AI Readiness Assessments Miss the Analytics Layer
The practical implication is straightforward: data readiness work is necessary, and it should continue. But it does not substitute for analytics estate readiness. Both layers need to be assessed and governed independently, because they address different problems with different tools and different owners. In most enterprise AI programs today, that parallel track is not yet in place.
WHAT THE ANALYTICS ESTATE NEEDS TO BE AI-READY FOR AGENTS
Four dimensions determine whether AI agents can read from the estate and return trusted answers.
Inventory Completeness. AI agents can only surface what they can see. An incomplete inventory produces incomplete answers. Each BI tool maintains its own catalog, but none of those catalogs see across tools. An organization running four BI tools has four partial, disconnected inventories. A complete, cross-tool inventory of every active report and dashboard is the prerequisite for everything else.
Certification Coverage. When an AI agent finds multiple versions of the same metric or report, it needs a machine-readable certification status to know which one is authoritative. Certification stored in a SharePoint wiki or a governance document is not machine-readable. The agent cannot make the distinction. Certification coverage needs to extend across the full analytics estate and be encoded in a form AI can interpret at query time.
Metric Governance. AI agents rely on metric definitions to interpret the numbers they surface. When those definitions are informal, undocumented, or inconsistently applied across teams and tools, AI returns answers that are numerically derived but contextually wrong. Each certified metric needs a designated owner, documented calculation logic, and a review cadence tied to policy changes.
Context Encoding. When an AI agent answers a question that spans multiple KPIs, it needs the approved relationship between those metrics encoded as business logic, not approximated from co-occurrence patterns in historical queries. An analytics context layer (https://www.zenoptics.com/blog/analytics-context-layer-enterprise/) that encodes these relationships is what separates AI that follows the business’s own logic from AI that reconstructs it by inference.
Atlas addresses the first three dimensions: cross-tool inventory, certification status, metric ownership, and review cadence across Power BI, Tableau, SAP BO, Qlik, and 100+ Smart Connectors. Nexus addresses Context Encoding by capturing structural metadata from BI tools and deriving the analytics context layer automatically from the governed estate Atlas produces, without requiring manual rebuilds. Together they address the layer AI agents read from in 2026. Organizations that govern their analytics estate with Atlas and Nexus typically see a 20-40% improvement in analytics discovery speed and a 30-40% reduction in duplicate reports.
The self-assessment for all four dimensions is in The AI Readiness Checklist Every Analytics Leader Should Complete.
FREQUENTLY ASKED QUESTIONS
Do enterprise AI agents query the data warehouse or the analytics layer?
In most enterprise AI deployments in 2026, AI copilots and agents read from the analytics layer: the reports, dashboards, metric definitions, and certified datasets that sit above the data warehouse. The data warehouse feeds the analytics layer. The analytics layer is the direct input to AI. An AI agent answering a business question reads from whatever analytics assets it can reach, not from the raw data tables below them. This is why data readiness and analytics estate readiness are separate problems.
What is the analytics estate in the context of AI agents?
The analytics estate is the full collection of reports, dashboards, certified KPIs, and business context that sits above the data layer and represents how the business measures itself. It is the layer AI agents read from when answering business questions. It is distinct from the data layer below it and from the AI application layer above it. Standard AI readiness frameworks assess the data layer. The analytics estate requires a separate assessment. The full framework is in Your Analytics Estate Isn’t AI Ready. Here’s How to Fix It.
Why does it matter if AI reads from uncertified reports?
An uncertified report carries no machine-readable signal that it is authoritative. When an AI agent finds multiple versions of the same metric or report, it has no basis to distinguish the certified version from an outdated or incorrect one. It surfaces whichever it locates. The result is AI outputs that read plausibly but are drawn from an unverified source. The business acts on them. The error reaches the decision, not the dashboard. Certification coverage across the analytics estate is what gives AI the signal it needs to distinguish trusted from untrusted sources.
How is the analytics estate different from a semantic layer?
A semantic layer translates database structures into business-readable terms inside a single BI tool or data platform. The analytics estate is broader: the entire collection of reports, dashboards, certified metrics, and business context an organization has built across all BI tools over time. It extends beyond semantic layers to include certification, ownership, governance, and encoded metric relationships that determine whether AI can read from the estate reliably. An analytics estate without those governance layers is not AI-ready even if it has well-built semantic layers within individual tools.
What does an AI-ready analytics estate look like?
An AI-ready analytics estate has a complete cross-tool inventory of every active report and dashboard, machine-readable certification status on analytics assets, documented metric ownership and calculation logic with a current review cadence, and metric relationships encoded in a machine-readable context layer rather than held informally. These four properties (Inventory Completeness, Certification Coverage, Metric Governance, and Context Encoding) define what it means for the analytics estate to be in a condition that AI agents can read from reliably. The self-assessment is in The AI Readiness Checklist Every Analytics Leader Should Complete.
A March 2025 McKinsey Global Survey of 1,491 respondents across 101 countries found that more than 80% of organizations are not seeing a tangible impact on enterprise-level EBIT from their gen AI investments. Three-quarters of those organizations already use AI in at least one business function. Deployment is not the problem. Standard AI readiness assessments were not designed to explain that gap.
Standard AI readiness frameworks were designed for a specific era: when deploying AI meant building and governing machine learning models. That era has not ended, but the dominant deployment pattern has shifted. Most enterprise AI in 2026 is not about building models. It is about deploying AI copilots and agents that read from existing analytics to answer business questions on demand. No major AI readiness framework has been updated to assess whether the analytics layer those systems read from is in any condition to be trusted.
The major frameworks in circulation cover the same dimensions with different vocabulary. OvalEdge’s framework organizes AI readiness across three dimensions: Why (purpose alignment and strategic intent), Who (workforce readiness and change management), and How (infrastructure, data quality, and governance capabilities). The Thinking Company’s 8-dimension model evaluates Leadership Commitment, Data Readiness, Technology Infrastructure, Talent and Skills, Process Maturity, Culture and Change Readiness, Governance and Ethics, and Strategic Alignment. Broader assessments from technology providers and consultancies (including Microsoft’s AI Readiness Assessment) address similar ground: data foundations, governance and security, infrastructure, and organizational alignment.
These are legitimate, well-structured frameworks. The dimensions they assess (data quality, governance at the pipeline level, infrastructure, talent, leadership alignment) are genuine prerequisites for enterprise AI. None of them are wrong to include.
The question is what era these frameworks were built for. They were designed when enterprise AI meant training models on data tables, and clean, governed, accessible data was the direct input to AI. That made data readiness the central question. When enterprise AI means deploying copilots and agents that query existing BI outputs, however, the direct input to AI is not the data warehouse. It is the analytics estate.
None of this is a criticism of those frameworks. They addressed the right problem for the right era. The issue is that the dominant enterprise AI use case shifted before any major assessment framework was updated to reflect it.
When an AI copilot or agent answers a business question in 2026, it does not query the data warehouse. It reads from the analytics estate: the reports, dashboards, certified metrics, and KPI definitions that sit above the data and represent how the business measures itself.
If a finance leader asks Microsoft Co-Pilot, “What is our Q2 gross margin by region?”, Co-Pilot does not process raw transaction records. It reads whatever gross margin report or metric definition it can locate in the analytics estate. If that estate contains three conflicting gross margin reports across Power BI, Tableau, and SAP BO, Co-Pilot returns whichever it finds first. The underlying data may be clean and well-governed. The analytics layer is not.
Most analytics leaders discover this gap the same way: their first AI copilot deployment delivers inconsistent answers, the investigation traces back to duplicate reports and uncertified metrics, and they realize that nothing in their readiness work assessed whether those reports and metrics were fit for AI to read. This is the readiness gap behind most enterprise AI trust failures. Standard AI readiness frameworks assess whether the data layer is ready. They do not assess whether the analytics estate is certified, inventoried, and structured in a form AI can interpret correctly.
The analytics estate has four dimensions of readiness that appear in no major AI readiness framework.
Inventory Completeness. Standard frameworks assess whether data is cataloged and governed. They do not assess whether every active report and dashboard across every BI tool in use (Power BI, Tableau, SAP BO, Qlik, and others) has been inventoried in a single, cross-tool view. Each BI tool maintains its own catalog. None see across tools. An organization running four BI tools has four partial, disconnected catalogs. AI agents reading from an incomplete inventory can only surface what they can see, which is typically a fraction of the full estate.
Certification Coverage. Standard frameworks assess data governance: who owns data tables, whether lineage is documented, whether quality thresholds are met. They do not assess whether analytics assets carry a machine-readable certification status that AI can distinguish from uncertified variants. When an AI agent finds multiple versions of the same metric or dashboard, it needs to know which one is certified. If that certification status lives in a SharePoint wiki or a Word file rather than a machine-readable governance layer, the AI cannot make the distinction.
Metric Governance. Standard frameworks assess data stewardship at the table and pipeline level. They do not assess whether each certified KPI has a designated owner accountable for its accuracy, whether calculation logic is documented, or whether there is a formal review cadence tied to policy changes. This is a different governance layer from data stewardship: different owners, different failure modes, different processes. Standard frameworks treat metric ownership as part of data stewardship. In most enterprises, it is not governed there at all.
Context Encoding. Standard frameworks assess data integration and lineage. They do not assess whether the relationships between certified metrics are encoded in a machine-readable format that AI agents can follow at query time. When an AI agent answers a question spanning multiple KPIs (revenue per account, net revenue retention, gross margin by channel), it needs the approved relationship between those metrics as the business defines it, not a reconstruction inferred from co-occurrence patterns in historical queries. An analytics context layer that encodes these relationships is what separates AI that follows business logic from AI that approximates it.
The self-assessment for all four dimensions is in The AI Readiness Checklist Every Analytics Leader Should Complete.
Standard frameworks were built for the right problem at the right time. Machine learning model deployment (the dominant enterprise AI pattern through roughly 2023) required assessing the data layer: pipelines, quality, lineage, access controls, and infrastructure. The analytics estate was not where AI systems read from in that era, so it was not where assessments looked.
The shift from model-building to agent-deployment happened faster than frameworks evolved. AI copilots and agents moved from experimental pilots to production enterprise deployments within roughly 18 months. Assessment frameworks take longer to update. The frameworks in broad use today reflect the 2021 to 2023 enterprise AI landscape. They have not been extended to assess the analytics estate those AI systems now read from.
In practice, an organization can score well on a standard AI readiness assessment (strong data quality, governed pipelines, trained workforce, aligned leadership) and then deploy AI copilots into an analytics estate that is entirely unprepared. The standard assessment did not assess the layer that is failing.
A complete AI readiness assessment in 2026 addresses both layers. The data layer assessment most organizations have already completed is not replaced. The analytics estate assessment is additive.
For the data layer, standard frameworks handle this well. If your organization has not completed one, begin there.
For the analytics estate layer, the four dimensions above (Inventory Completeness, Certification Coverage, Metric Governance, and Context Encoding) require a separate, dedicated assessment. No standard framework reaches them.
Atlas addresses the first three dimensions by maintaining the certified analytics estate across BI tools continuously: cross-tool inventory, certification status, metric ownership, and review cycle tracking across Power BI, Tableau, SAP BO, Qlik, and 100+ connected systems. Nexus addresses Context Encoding by deriving the analytics context layer automatically from the governed estate Atlas produces. Together they address the four dimensions standard frameworks do not reach. Organizations that govern their analytics estate with Atlas and Nexus typically see a 20–40% improvement in analytics discovery speed and a 30–40% reduction in duplicate reports.
What do standard AI readiness assessments typically cover?
Standard assessments evaluate data quality, data governance at the pipeline level, technology infrastructure, talent and skills, leadership alignment, organizational culture, and strategic readiness. The most comprehensive frameworks add responsible AI governance and regulatory compliance. None assess the analytics estate: the reports, dashboards, certified metrics, and business context AI systems read from when answering business questions. That layer requires a separate, dedicated assessment.
Why do organizations fail at AI deployment even after passing a standard readiness assessment?
Standard assessments evaluate the data and infrastructure layer: the foundation AI models are built on. AI copilots and agents read from the analytics estate, not the data warehouse directly. An ungoverned analytics estate produces inconsistent AI outputs regardless of how well the underlying data scores on quality and governance checks. Passing a data-layer assessment and then deploying AI into an uncertified analytics estate is the pattern behind most enterprise AI trust failures.
How is analytics estate readiness different from data readiness?
Data readiness assesses whether data is clean, accessible, and governed at the pipeline and warehouse level. Analytics estate readiness assesses whether the reports, dashboards, and certified metrics AI systems read are accurate, certified, and governed. These address different layers, with different owners, different processes, and different failure modes. Most enterprises have active data readiness programs. Very few have started analytics estate readiness programs. In most organizations, no single person currently owns both.
Which AI readiness framework is most complete for enterprise AI deployment in 2026?
No standard framework currently addresses the analytics estate layer. The Thinking Company’s 8-dimension model and Microsoft’s AI Readiness Assessment are among the more comprehensive general frameworks available, covering data readiness, governance, infrastructure, talent, and culture rigorously. Neither extends to analytics estate inventory, certification coverage, metric governance, or context encoding. A complete assessment in 2026 requires both: a standard framework for the data layer, plus the four-dimension analytics estate assessment. The self-assessment is in The AI Readiness Checklist Every Analytics Leader Should Complete.
What is the analytics estate in the context of AI readiness?
The analytics estate is the full collection of reports, dashboards, certified KPIs, and business context that AI agents read when answering business questions. It sits above the data layer and below the AI application layer. Standard AI readiness frameworks assess the data layer. The analytics estate requires its own assessment. The framework for understanding this layer is in Your Analytics Estate Isn’t AI Ready. Here’s How to Fix It.
Every AI readiness framework circulating in mid-2026 assesses the same layer: data quality, infrastructure, governance controls at the pipeline level, talent maturity. These frameworks are necessary. They are also incomplete in one specific, consequential way: none of them assess whether the analytics estate your AI systems will read from is ready. A 2025 IBM study of 1,700 CDOs found that only 26% are confident their data can support new AI-enabled revenue streams. That confidence gap is real. The harder gap sits one layer above the data, where most readiness frameworks stop looking.
Standard AI readiness frameworks address the data layer: what data the organization has, how clean it is, whether it is accessible, and whether the infrastructure can support AI workloads. All of this matters.
What none of these frameworks address is whether the analytics estate your AI systems read from is in any condition to be trusted. When an AI agent or copilot answers a business question, it does not query the data warehouse. It reads from the reports, dashboards, KPI definitions, and certified datasets that sit above the data: the analytics estate. A clean data foundation feeding an ungoverned analytics estate produces the same inconsistent AI outputs as a poorly governed data layer, just at a different level.
This is the readiness gap behind most enterprise AI trust failures. If you have already run a standard AI readiness assessment and are still getting conflicting AI outputs, this is the assessment you have not completed yet.
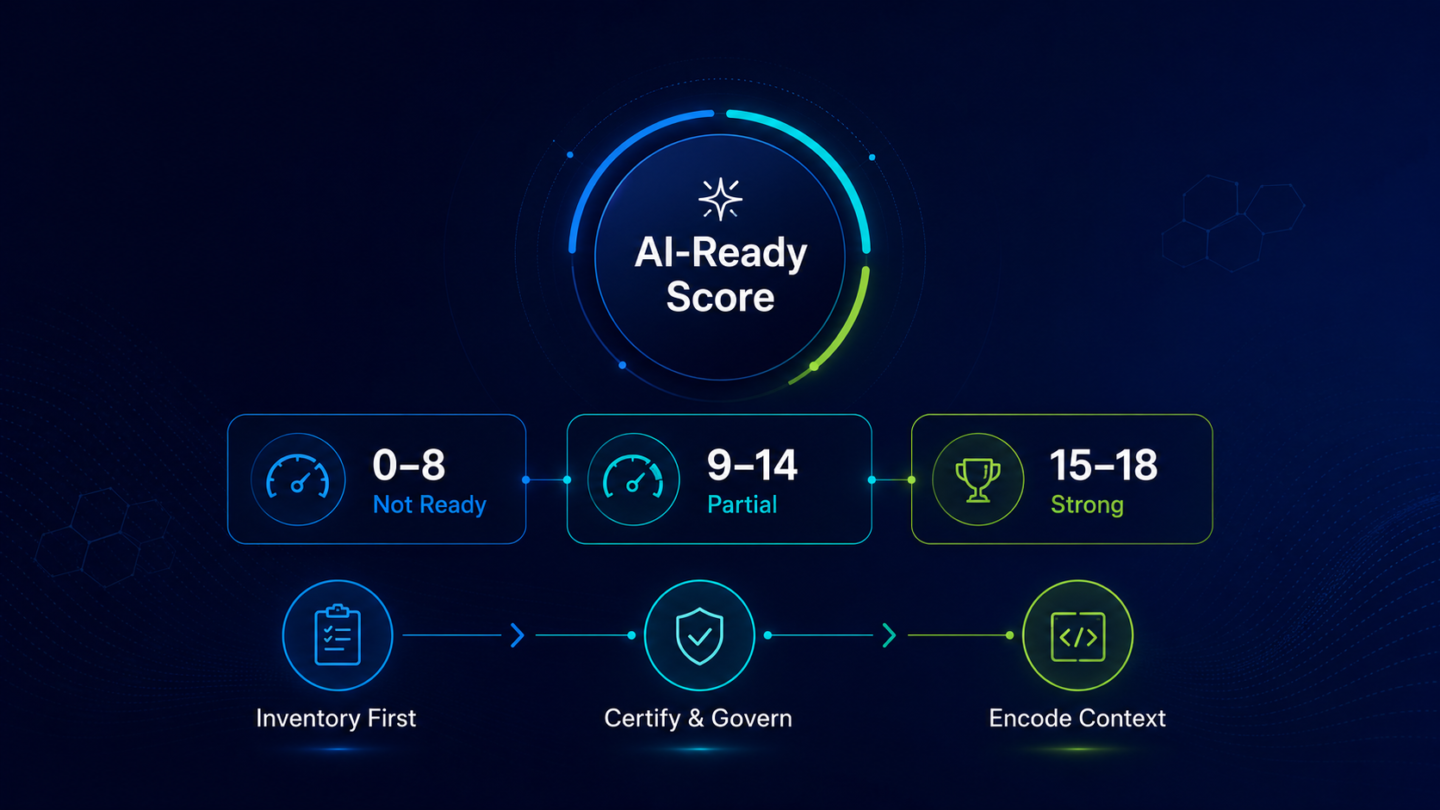
Four sections. Each corresponds to a dimension of analytics estate readiness. Score one point for every Yes. Total possible score: 18.
Can your AI see the full analytics estate, or only the part that lives in one tool’s catalog?
Does your AI know which version of a metric to trust when it finds several?
Does your AI know who owns each metric, when it was last verified, and what it actually calculates?
When AI answers a question spanning multiple KPIs, does it follow your business logic, or reconstruct it by inference?
15–18: The analytics estate is in strong AI-ready condition. AI tools querying this estate will likely return consistent, trusted outputs. The primary task now is sustaining certification coverage and keeping the context layer current as the business evolves.
9–14: Partial readiness. AI outputs will be inconsistent: some queries will land on certified, well-governed assets; others will surface uncertified variants or follow inferred metric relationships that do not match your actual business logic. The sections where you scored lowest are where trust failures are most likely to originate.
0–8: The analytics estate is not AI-ready. This is the pattern behind most enterprise AI trust failures. Standard AI readiness assessments will not surface this gap; they do not assess this layer.
One note worth stating clearly: this score is independent of your data readiness score. An organization can have strong data readiness and still score poorly here. Most enterprises have started data readiness programs. Very few have started analytics estate readiness programs. The two address different problems, and neither substitutes for the other.
The four sections build on each other, and the sequencing matters more than most analytics leaders initially expect.
Start with Section 1. You cannot govern what you cannot see. A complete, current cross-tool inventory is the prerequisite for everything else. Without it, your certification and governance scores in Sections 2 and 3 are incomplete by definition; they reflect only the portion of the estate visible to your current catalogs. In practice, most organizations discover three to four times more active analytics assets in this step than their single-tool catalogs had shown them.
Address Sections 2 and 3 together. Certification without governance becomes stale: a metric certified eighteen months ago under a cost allocation policy that has since changed is not a reliable source of truth, regardless of its certification status. Governance without certification has nothing authoritative to apply to. The metric to track across both sections: what percentage of the active analytics estate carries a certified status with a current owner and a last-reviewed date within the past twelve months.
Context encoding, Section 4, follows the estate. Building a machine-readable context layer before the underlying estate is certified and governed produces a context layer that reflects the estate’s disorder rather than the business’s intent. The context layer is derived from the estate. What goes in comes out.
Atlas addresses Sections 1 through 3 by maintaining the certified analytics estate across BI tools continuously: inventory, certification, ownership, and review cycle tracking across Power BI, Tableau, SAP BO, Qlik, and 100+ connected systems. Nexus addresses Section 4 by deriving the analytics context layer automatically from the governed estate Atlas produces. Together, they address all four dimensions without requiring a manual rebuild of the analytics estate from scratch. Organizations that bring their analytics estate under governance with this approach typically see a 20–40% improvement in analytics discovery speed and a 30–40% reduction in duplicate reports.
Is this checklist a replacement for a standard AI readiness assessment?
No. Standard AI readiness assessments cover data quality, infrastructure, talent, and governance at the pipeline level. This checklist covers the analytics estate layer: the reports, dashboards, KPI definitions, and business context AI systems read from when answering business questions. Both assessments are necessary. Most organizations have completed a version of the standard assessment. Very few have completed this one.
Who should complete this checklist?
Accurate results require input from at least two or three people: the analytics or BI leader for Sections 1 and 2, a data governance lead or metric owner for Section 3, and whoever is responsible for AI deployment or the analytics context layer for Section 4. In most organizations, no single person holds all of this. Running the checklist as a group conversation often surfaces disagreements about ownership and certification coverage that are worth resolving before the next AI deployment.
How often should this assessment be run?
Quarterly, at minimum, for organizations with active AI deployments. The analytics estate changes continuously: reports are added, metrics are recalculated, owners change roles, business logic evolves. An annual pass underestimates that rate of change considerably.
How does this differ from a BI maturity assessment?
A BI maturity assessment measures how advanced the analytics function is: tools, processes, capability levels. This checklist assesses one specific property: whether AI systems can read from the analytics estate reliably and consistently. A high BI maturity score does not guarantee a high score here. An organization can have sophisticated analytics capabilities and still have low certification coverage across the full estate, or no machine-readable context encoding at all.
Where can I find the full framework behind this checklist?
The four dimensions assessed here, along with the organizational patterns behind most analytics estate readiness failures, are covered in depth in Your Analytics Estate Isn’t AI Ready. Here’s How to Fix It.
Every major AI readiness framework published in the last two years assesses the same things: data infrastructure quality, pipeline reliability, talent maturity, technology stack, and governance controls at the data layer. These assessments are useful. They are also incomplete in a way that consistently produces the same failure pattern in enterprise AI deployments.
When AI agents and copilots answer business questions, they do not read from the data layer. They read from the analytics estate: the reports, dashboards, KPI definitions, semantic models, and business context that sits above the data and below the AI. An enterprise that has invested in data readiness but not analytics estate readiness has a clean foundation feeding an ungoverned surface. The AI reads from the surface. If that surface is ungoverned, the outputs are inconsistent, untraceable, and untrustworthy regardless of how mature the data infrastructure beneath it is. The readiness gap that determines whether AI actually works for the business is the one almost no framework is measuring.
Data readiness programs address the infrastructure layer: data quality, schema governance, pipeline reliability, access controls, and cloud modernization. These programs are necessary prerequisites for enterprise AI. They address whether the organization’s data is in a state where AI systems can access and process it.
Analytics estate readiness addresses a different layer entirely. It addresses whether the organization’s analytics content is in a state where AI systems can reason from it correctly. The analytics estate is the set of reports, dashboards, certified datasets, KPI definitions, semantic models, and business context documents that the organization uses to make decisions. It is the layer that translates raw data into business meaning. AI agents and copilots operate at this layer, not at the data layer.
The distinction matters because an organization can have excellent data readiness and poor analytics estate readiness simultaneously. A clean, well-governed data lake can feed four conflicting definitions of gross margin across four separate Power BI datasets. Each dataset is built on high-quality, properly pipelined data. None of them agrees on what gross margin means. When an AI agent answers a question about margin performance, it reads from those four conflicting datasets and synthesizes an answer from all of them. The data infrastructure is not the problem. The analytics estate is.
This is the pattern that produces what looks like AI hallucination in enterprise analytics contexts but is not hallucination at all: it is accurate retrieval from an ungoverned analytics surface.
Understanding what AI agents read from is the prerequisite for fixing it. When an enterprise deploys an AI agent or copilot against its analytics environment, that agent traverses the analytics estate at query time. Depending on the deployment, it reads from some combination of: Power BI or Tableau semantic models, certified and uncertified datasets, report and dashboard metadata, business glossary entries where they exist, KPI documentation in wikis or catalogs, and in Microsoft Fabric environments, content from Excel, SharePoint, and OneLake.
The estate is the source of truth the AI reasons from. It is not a static, curated input that someone has prepared for the AI. It is the full, accumulated result of years of BI development: reports built by different teams for different purposes, datasets created for projects that ended but were never retired, KPI definitions documented by one team that contradict the definitions used by another. Every organization with a multi-year BI history has an analytics estate that reflects that accumulation.
When an AI agent reads this estate, it surfaces what it finds. It has no native mechanism to determine which version of a metric is authoritative, which dataset has been certified as the source of record for a given reporting context, or how the organization’s certified metrics relate to each other when a question spans multiple KPIs. The analytics knowledge graph is the infrastructure that encodes those relationships. Without it, the AI constructs them by inference. The quality of the output reflects the quality of the estate being read.
Making the analytics estate AI-ready is a governance program, not a configuration task. It operates across four dimensions. Each dimension can be assessed independently and addressed in sequence. Together, they describe what an AI-ready analytics estate looks like and where most enterprise estates fall short.
Dimension 1: Inventory completeness. An AI-ready analytics estate requires a complete, current inventory of every active report, dashboard, KPI, and certified dataset across all BI tools the organization uses. AI cannot govern what it cannot see. Most enterprise estates are inventoried partially and separately: the Power BI catalog covers Power BI assets, the Tableau server covers Tableau workbooks, and Excel-based reports and SharePoint-hosted dashboards are not inventoried at all. Cross-tool inventory completeness is the foundation everything else depends on. Without it, the AI estate assessment is incomplete by definition.
Dimension 2: Certification coverage. Of the assets in the inventory, the key measure is the proportion that has been designated as authoritative. Certification is the process of designating a specific version of a report, dashboard, or metric definition as the organization’s approved source of record for a defined reporting context. In most enterprise estates, certification coverage is low: Power BI has a certification mechanism that is partially used, other BI tools have ad hoc promotion processes, and the majority of analytics assets have no certification status at all. Uncertified assets surface in AI queries alongside certified ones. Without high certification coverage, the AI has no basis for distinguishing between the authoritative version of a metric and an outdated variant, and it does not attempt to make that distinction.
Dimension 3: Metric governance. Certification establishes which version of a metric is authoritative. Metric governance establishes who owns it, when it was last reviewed, what its calculation logic is, and which reporting contexts it governs. These records are what make certification trustworthy over time rather than a one-time designation that becomes stale. A metric certified eighteen months ago by a team that has since reorganized, with calculation logic that predates a revenue recognition policy change, is not a reliable source of truth. Metric governance is the program that maintains certification accuracy through formal ownership and review cycles. Most enterprise analytics programs have no equivalent of this at the metric layer; data governance addresses the data infrastructure, and the metric layer is ungoverned by default.
Dimension 4: Context encoding. The first three dimensions address individual assets: inventory, certification, and governance of reports, dashboards, and metrics as standalone objects. Context encoding addresses the relationships between them. When an AI agent answers a multi-metric business question, such as why operating margin contracted when revenue grew in Q3, it needs to understand how the organization’s certified metrics connect: which version of revenue is authoritative for this context, how operating costs relate to gross margin in the certified calculation hierarchy, and what the approved analytical path is for this class of question. The analytics context layer encodes those relationships as governed facts the AI can follow. Without context encoding, the AI infers the relationships statistically from co-occurrence patterns in the datasets it reads. The difference between a governed relationship and a statistically inferred one is the difference between an answer grounded in the organization’s business logic and an answer that approximates it.
Assessing enterprise analytics estates against these four dimensions produces a consistent pattern. Inventory completeness is almost always partial: BI tool catalogs exist within their own environments, cross-tool estates are not inventoried as a single coherent set of assets, and a significant proportion of actively used reports exist outside any formal catalog.
Certification coverage is low relative to the full estate. Power BI certification is the most commonly deployed mechanism, but even within Power BI, the proportion of datasets carrying certified status is typically a fraction of the total active estate. Content outside Power BI is almost never formally certified against an enterprise standard.
Metric governance is the dimension where the gap is widest. The concept of a designated metric owner with a formal review cadence and documented calculation logic is familiar from data governance programs applied to master data. Applied to the analytics metric layer, it is rare. Metrics are defined when dashboards are built and updated informally when business logic changes. Ownership is implicit rather than designated. Review cycles do not exist.
Context encoding, as a formal program, is absent in nearly all enterprise analytics estates that have not specifically invested in an analytics context layer. The relationships between certified metrics exist in subject matter experts’ heads and in informal documentation. They are not encoded in a form AI agents can follow.
This is why RAG architectures deployed against ungoverned analytics estates produce the same failure pattern as direct AI queries: the retrieval system surfaces what exists, and what exists reflects all four dimensions of unreadiness. The architecture does not compensate for the estate’s condition.
ZenOptics addresses all four dimensions of analytics estate readiness through three connected products, each targeting a specific layer of the problem.
Atlas, ZenOptics’s Analytics System of Record, addresses inventory completeness and metric governance. Atlas continuously inventories the analytics estate across Power BI, Tableau, Fabric, and connected BI tools, maintaining a living record of every active report, dashboard, KPI, and dataset in the environment. It establishes and maintains certification records, ownership designations, and review cycle tracking for every authoritative analytics asset. The estate inventory is not a one-time audit: Atlas keeps it current as assets are added, modified, retired, or recertified. The result is a governed, maintained record of what the analytics estate contains and what within it has been designated as authoritative.
Nexus, ZenOptics’s AI Context Layer for Analytics, addresses certification coverage and context encoding. Nexus derives the analytics knowledge graph from the certified estate Atlas governs, encoding the relationships between certified metrics in a machine-readable structure AI agents can follow. It provides the certification metadata and cross-metric relational context that transforms AI queries from inference operations on an ungoverned estate into governed retrieval from a certified one. When an AI agent queries the estate with Nexus providing the context layer, it receives not just the relevant metrics but the governance records that establish which version is authoritative and how it connects to the other certified metrics the question requires.
Maestro, ZenOptics’s AI-Driven Business Processes layer, is the AI agent layer that operates on top of the governed estate Atlas and Nexus produce. Maestro’s AI agents perform reliably because the estate beneath them has been made AI-ready. The AI agent quality is a function of the estate quality. Maestro is built on the premise that AI agents operating on a governed analytics estate produce different outcomes than AI agents operating on an ungoverned one. That premise is what the first four sections of this post establish.
The outcome of analytics estate readiness is not a different AI model. It is a different surface for the same AI to read from. This distinction matters because it explains why prompt engineering, model fine-tuning, and retrieval configuration improvements produce limited results when the underlying estate is ungoverned: the problem is not the AI, it is the estate.
In the ungoverned scenario, a business leader asks an AI agent about Q3 operating margin. The agent traverses the estate and finds three definitions of operating margin across four datasets, two of which are certified in Power BI and two of which are uncertified project models that were never retired. It synthesizes across all four, returns a figure, and surfaces the certified Power BI dataset as the primary source. The figure does not match the finance team’s Q3 close number. No one can reconcile it without investigating which datasets the agent weighted and why. The follow-up investigation takes longer than the original question would have taken to answer manually.
In the governed scenario, the same AI agent queries the estate with Atlas’s inventory and certification records and Nexus’s knowledge graph context available at query time. Atlas has certified one version of operating margin as authoritative for Q3 close reporting, with the finance team as designated owner and a review date from last month confirming the calculation reflects the current cost allocation policy. Nexus has encoded operating margin’s relationship to the gross margin and SG&A metrics the agent needs for the full answer. The agent surfaces the certified Q3 close version, returns the correct figure, and the reasoning path is traceable back to the certified source records. The answer matches the finance team’s close number because it came from the same certified source. It is consistent across every team member who asks the same question and auditable at the metric level.
No prompt engineering produced this outcome. No model change produced it. The estate change produced it.
What is the difference between data readiness and analytics estate readiness?
Data readiness describes the state of an organization’s data infrastructure: data quality, pipeline reliability, schema governance, and access controls at the data layer. Analytics estate readiness describes the state of the analytics content that AI agents actually read from: the reports, dashboards, KPI definitions, semantic models, and business context documents that translate data into business meaning. An organization can have excellent data readiness and poor analytics estate readiness simultaneously. Data readiness addresses the foundation. Analytics estate readiness addresses the surface AI agents operate on.
What does an AI-ready analytics estate look like in practice?
An AI-ready analytics estate has four properties. The full estate across all BI tools is inventoried in a single, continuously maintained record. Every authoritative metric, report, and dashboard has been designated as certified, with a designated owner, a last-reviewed date, and documented calculation logic. Certification coverage extends across the full estate, not just within a single BI tool’s catalog. And the relationships between certified metrics are encoded in a machine-readable knowledge graph AI agents can follow for multi-metric questions. Organizations with these four properties in place see consistent, traceable AI outputs across query types and reporting contexts.
Does building an AI-ready analytics estate require replacing existing BI tools?
No. Analytics estate readiness operates above the BI tool layer, not within it. Atlas inventories and certifies assets across Power BI, Tableau, Fabric, and connected BI environments without replacing them. Nexus provides the context layer above the tools that AI agents read from. The existing BI estate remains in place; the analytics context layer is built on top of it to make the estate AI-readable. The investment is in governance and context, not in tool migration.
How long does it take to make an analytics estate AI-ready?
The timeline depends primarily on the size of the estate, the current state of certification coverage, and whether metric ownership programs exist. Most enterprise AI deployments that attempt to address analytics estate readiness after encountering trust failures lose two to three quarters to misdiagnosis before identifying the estate as the source. Organizations that address estate readiness before AI deployment typically compress that timeline significantly. Atlas’s continuous inventory approach means the estate does not need to be governed all at once: the highest-priority metrics and reports can be certified first, creating a governed core the AI operates from while the broader estate is brought into compliance.
What is the Analytics Estate Assessment Scorecard and how do I use it?
The Analytics Estate Assessment Scorecard is a structured evaluation tool that maps an organization’s analytics estate against the four dimensions of AI readiness: inventory completeness, certification coverage, metric governance, and context encoding. It produces a score across each dimension and identifies the specific gaps most likely to produce AI trust failures in the current environment. The Scorecard is available as a gated resource through ZenOptics and takes approximately 15 minutes to complete for a BI leader or CDO with knowledge of the current analytics environment.
Where do most enterprises fall short on analytics estate readiness?
Metric governance is consistently the widest gap. Most enterprises have some form of inventory mechanism within individual BI tools, and Power BI certification is increasingly deployed, but the concept of a formally designated metric owner with a documented review cadence and explicit calculation logic at the metric layer is uncommon. Context encoding is absent in virtually all enterprise estates that have not specifically invested in an analytics context layer: the relationships between certified metrics exist informally but are not encoded in a machine-readable structure AI can follow. These two dimensions produce the most severe AI trust failures because they affect every multi-metric question an AI agent is asked.
Retrieval-Augmented Generation has become the standard architecture for enterprise AI deployments that need to operate on organizational knowledge rather than general training data. In analytics contexts, the argument for RAG is straightforward: point the retrieval system at the BI estate, and the AI will pull the relevant reports, metric definitions, and KPI data it needs to answer business questions accurately. The model stops relying on what it was trained on and starts working with what the organization actually has.
That argument is correct as far as it goes. RAG addresses a real problem. It gives AI systems access to current, organization-specific content at query time rather than approximating it from training weights. In enterprise analytics, that access matters.
What RAG does not address is the governance problem: whether what it retrieves is the certified, authoritative version of each metric, whether the sources it surfaces have been designated as trustworthy for AI use, and whether the relational structure that connects those metrics is encoded in a way AI can follow. Access and governance are different problems. RAG solves the first one. The second requires a different layer entirely.
Retrieval-Augmented Generation emerged as a solution to a specific limitation of large language models: the knowledge cutoff. Models trained on data up to a fixed point cannot answer questions about events, documents, or organizational information that postdates their training. RAG addresses this by retrieving relevant content from a connected knowledge source at query time and providing it to the model as context, giving the AI access to current, specific information rather than forcing it to approximate from stale training weights.
In enterprise analytics deployments, RAG is used to connect AI tools to the organization’s BI content: reports, dashboards, KPI definitions, and metric documentation stored in knowledge bases, analytics catalogs, or document repositories. When a business leader asks the AI about Q2 margin performance, the RAG system retrieves the relevant content from the connected knowledge base and passes it to the model as context. The model generates an answer from what was retrieved rather than from general knowledge.
This is genuinely useful infrastructure. It is also the right solution to the access problem: making the organization’s analytics content available to AI at query time. The limitation is not in what RAG was designed to do. It is in what RAG was never designed to do: evaluate the trustworthiness of what it retrieves, enforce certification hierarchies, or encode the governance relationships between metrics that AI needs to reason correctly across a complex analytics estate.
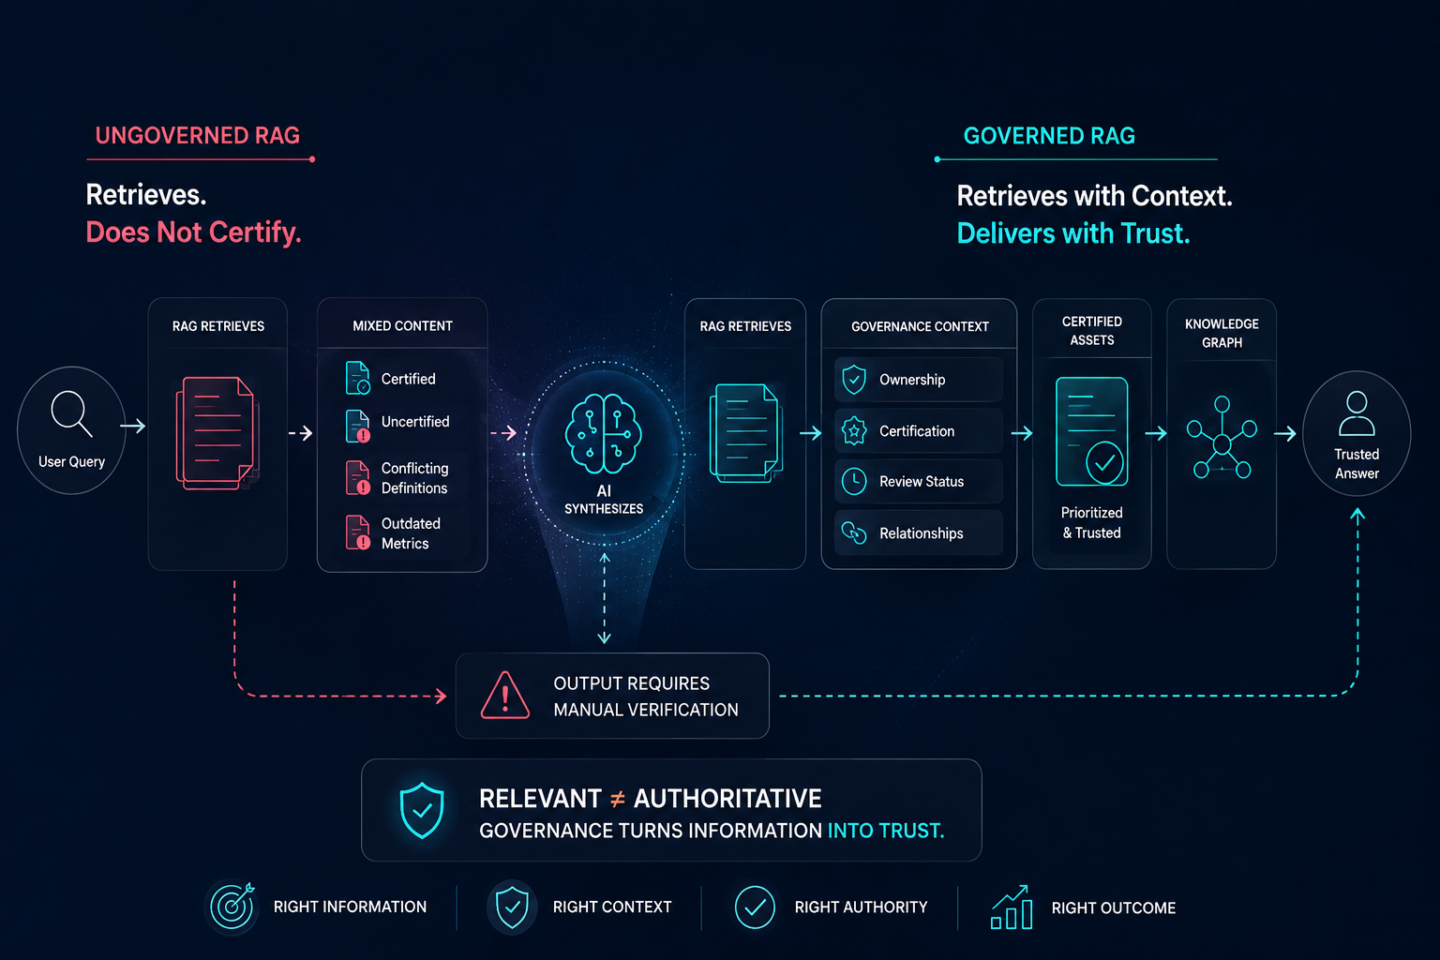
RAG retrieves. It does not certify.
When a RAG system queries an enterprise BI estate for content related to a net revenue question, it retrieves the documents and metrics most relevant to the query according to its retrieval algorithm. What it has no mechanism to do is evaluate which of those documents represents the certified, authoritative version of net revenue and which represents a regional variant, an outdated calculation, or a shadow dashboard a business unit built independently and never reconciled with the finance team’s version.
All of them are in the knowledge base. All of them are relevant to the query. All of them get retrieved. The model receives multiple conflicting definitions of the same metric with no signal about which one carries authoritative status. It synthesizes an answer from all of them. That answer is confidently delivered and wrong in ways that are hard to trace, because the retrieval step looked successful: relevant content was found and passed to the model. The failure is invisible at the retrieval layer and surfaces at the answer layer as a trust failure that gets misattributed to model behavior.
This is the same governance failure described in Enterprise AI Doesn’t Hallucinate. It Reads Ungoverned Analytics, but with a more sophisticated architecture producing the same result. RAG did not solve the problem. It made the path to the ungoverned content faster.
Three retrieval behaviors that are features in general knowledge contexts become failure modes when applied to enterprise analytics estates without a governance layer.
Retrieval equality across certified and uncertified assets. RAG retrieval algorithms rank results by relevance to the query, typically using semantic similarity. A certified authoritative dashboard and an uncertified regional dashboard that both discuss net revenue will rank similarly on semantic relevance grounds. The retrieval system has no native concept of certification status. Both get returned. Both enter the model’s context window with equal weight. The model has no basis for distinguishing between them and no instruction to prefer one over the other.
Recency bias toward uncertified content. Many retrieval implementations weight recently modified content more heavily, on the assumption that more recent documents are more accurate. In an enterprise analytics estate, recently modified content is often a work-in-progress dashboard or a revised regional report that has not yet been reviewed, certified, or aligned with the authoritative version. The certified authoritative metric may have been stable and unchanged for months. The recency bias in retrieval surfaces the uncertified recent variant over the certified stable one. The retrieval system is working as designed. The governance context that would prevent this is absent.
No encoding of cross-metric governance relationships. RAG retrieves individual documents and metrics. It does not encode the governed relationships between metrics that multi-metric business questions require. When an AI agent answers a question that spans revenue, cost of goods, and operating margin, it needs to understand how those metrics connect in a governed hierarchy specific to this organization: which version of each is authoritative, in what sequence they should be applied, and what the certified calculation logic is at each step. The analytics knowledge graph encodes that relational structure. RAG has no equivalent. It retrieves individual assets and leaves the AI to construct the relationships through statistical inference.
The analytics context layer is the governance infrastructure that RAG needs beneath it to produce trusted outputs in enterprise analytics. It addresses the three RAG failure modes directly.
It resolves retrieval equality by providing certification metadata for every analytics asset in the estate. When the retrieval system has access to the context layer, it knows which version of each metric carries certified authoritative status, which are under review, and which are uncertified regional variants. That metadata can be used to filter retrieval results, weight certified assets preferentially, or instruct the model to apply the certified definition when conflicts exist in the retrieved context.
It resolves recency bias by providing ownership and review cycle records that establish trustworthiness independently of modification date. A certified metric that was reviewed and confirmed six months ago is more trustworthy than an uncertified metric modified yesterday. The context layer carries that distinction. RAG without the context layer cannot make it.
It resolves the relational gap by providing the knowledge graph structure that encodes how certified metrics connect in this organization’s governed hierarchy. The model does not need to infer the relationships between revenue, margin, and operating performance metrics. The graph provides them as governed facts derived from the certified analytics estate. Retrieval draws on the graph to surface not just relevant individual metrics but the correct relational context for the question being asked.
Together, these three capabilities transform RAG from a capable retrieval system operating on an undifferentiated estate into a governed retrieval system operating on a certified one. The architecture is the same. What changes is what the retrieval system has to work with.
The difference between governed and ungoverned RAG shows up in a single consistent pattern: governed retrieval produces answers that stakeholders can act on; ungoverned retrieval produces answers that require manual verification before anyone will act on them.
In ungoverned retrieval, the business leader asks about Q2 net revenue. The RAG system retrieves the three most semantically relevant documents from the knowledge base. All three are about net revenue. All three carry different figures. The model synthesizes a response from all three and returns a number. The CFO cannot reconcile it with the finance team’s version. The commercial lead cannot reconcile it with their dashboard. The answer goes into a follow-up investigation rather than informing a decision.
In governed retrieval, the same query goes through a RAG system that has access to the analytics context layer. Atlas, ZenOptics’s Analytics System of Record, has certified one version of net revenue as authoritative for commercial reporting and designated the finance team’s version for P&L purposes. The context layer carries those certification records. The RAG system retrieves the certified commercial version for this query context. The model returns the certified figure. The answer matches the commercial team’s expectation and is traceable to the certified source it came from.
The retrieval architecture is the same in both scenarios. The governance layer beneath it is what produces the different outcome.
Enterprise AI teams making architecture decisions about their analytics deployments face a consistent pressure: RAG is the established pattern, the tooling is mature, and the implementation path is well-understood. The instinct is to implement RAG and then investigate governance if trust problems emerge.
The problem with that sequencing is that governance problems in analytics estates take longer to diagnose than they take to establish. An enterprise that deploys RAG against an ungoverned BI estate, experiences trust failures, investigates the retrieval configuration, adjusts the model, and still cannot resolve the inconsistency has lost quarters on a misdiagnosis before reaching the correct one: the source estate is not governed and no retrieval configuration will produce trusted outputs from it.
The correct sequence is to establish the governance layer first, then build retrieval on top of it. Nexus, ZenOptics’s AI Context Layer for Analytics, is built for this architecture. Nexus automatically derives the analytics context layer from the organization’s existing BI metadata through Atlas, certifies the authoritative assets, encodes the relational structure in the knowledge graph, and makes the full governance context available for retrieval systems to use. Organizations implementing this architecture see AI deployment timelines compress two to three times. The retrieval system operates on a governed foundation from the first query rather than producing trust failures that require investigation and remediation before the deployment can be trusted.
The right starting point for enterprise AI architects is not RAG configuration. It is the state of the analytics estate before retrieval is built on top of it. That estate needs to be governed before RAG can retrieve from it reliably. Analytics context engineering is the function that builds and maintains that governance. RAG is the retrieval layer that operates on top of it.
The organizations that produce trusted AI analytics outputs at scale are not the ones with the most sophisticated retrieval configurations. They are the ones that governed their analytics estates before building retrieval on top of them.
What is RAG and why is it used in enterprise analytics?
Retrieval-Augmented Generation is an AI architecture pattern in which a retrieval system fetches relevant content from a connected knowledge source at query time and provides it to the AI model as context. In enterprise analytics, it is used to give AI tools access to current, organization-specific BI content: reports, dashboards, and metric definitions that postdate the model’s training data or are specific to the organization. RAG is the right solution to the access problem in enterprise AI: ensuring the model can work with current, organizational content rather than approximating from training weights.
Why does RAG not solve the analytics AI trust problem on its own?
RAG retrieves the most relevant content from the connected knowledge base. It does not evaluate whether what it retrieves is certified as authoritative, whether it represents the correct version of a metric for the reporting context of the query, or how the retrieved metrics relate to each other in the organization’s governance hierarchy. When an enterprise BI estate contains multiple versions of the same metric with no certification designating one as authoritative, RAG surfaces all of them with equal retrieval weight. The model synthesizes an answer from conflicting sources and returns a confidently delivered but incorrect response. The retrieval step completed successfully. The governance layer that would have prevented the conflict was absent.
What is the difference between RAG retrieval and governed retrieval?
In standard RAG retrieval, the retrieval system ranks and surfaces content by semantic relevance to the query without reference to certification status, ownership records, or governance hierarchy. In governed retrieval, the retrieval system has access to an analytics context layer that carries certification metadata for every asset in the estate. The retrieval system can filter results by certification status, weight certified assets over uncertified variants, and draw on the knowledge graph to surface the relational context that multi-metric queries require. The architecture is the same. The governance metadata beneath it is what produces different outcomes.
How does the analytics context layer work with RAG?
The analytics context layer provides three inputs that RAG needs to retrieve correctly in enterprise analytics: certification metadata that identifies which version of each metric is authoritative and for which reporting contexts, ownership and review records that establish trustworthiness independently of modification date, and the knowledge graph that encodes the governed relationships between certified metrics. RAG retrieval systems with access to these inputs can filter by certification, prefer certified assets in ranking, and surface relational context alongside individual metrics. Without the context layer, the retrieval system operates on an undifferentiated knowledge base with no mechanism for distinguishing authoritative from uncertified content.
Does this mean RAG is the wrong architecture for enterprise analytics AI?
No. RAG is the right architecture for the access problem it was designed to solve: giving AI tools access to current, organization-specific content at query time. The limitation is not in the RAG architecture. It is in deploying RAG against an ungoverned analytics estate and expecting it to produce governed outputs. RAG is a retrieval mechanism. The governance of what it retrieves is a separate requirement that the analytics context layer addresses. Both are necessary. RAG without a governance layer produces capable retrieval from an ungoverned source. RAG with a governance layer produces governed retrieval from a certified source.
What does a governed RAG implementation look like in practice?
A governed RAG implementation for enterprise analytics has four components working together. An analytics system of record, Atlas in the ZenOptics architecture, continuously inventories the BI estate and maintains certification records for every authoritative metric, report, and KPI. An analytics context layer, Nexus in the ZenOptics architecture, derives the certification metadata, ownership records, and knowledge graph structure from the certified estate. A RAG retrieval system queries the knowledge base with access to the context layer metadata, using certification status and governance hierarchy to weight retrieval results. And the AI model receives retrieved context that has been filtered and ranked against the organization’s governance structure rather than by semantic similarity alone. The result is retrieval that surfaces certified, authoritative analytics content for every query, with the relational structure that multi-metric reasoning requires encoded in the knowledge graph rather than inferred by the model.
The word “hallucination” has become the default explanation for enterprise AI outputs that cannot be reconciled with what the business knows to be true. A revenue figure the CFO does not recognize. A churn rate that contradicts the CRM. A margin number three finance teams disagree on, each of whom is certain their version is correct. When the AI returns one of these irreconcilable answers, the diagnosis is almost always the same: the model hallucinated.
In the majority of enterprise analytics failures, that diagnosis is wrong. And acting on it leads organizations to invest in the wrong fix while the actual problem compounds. The model did not hallucinate. It read an ungoverned analytics estate and returned exactly what it found. The distinction between those two things is not semantic. It determines whether the next investment goes toward model improvement or toward the governance program that actually resolves it.
Hallucination, in the precise sense, refers to a model generating plausible-sounding content with no grounding in the source data it was given. The model produces a citation that does not exist, a statistic with no source, a fact that has no basis in any document it read. This is a documented model behavior in generative language tasks, and it is a legitimate concern for enterprise teams deploying AI in content generation, summarization, and research contexts.
It does not describe what happens when an enterprise AI copilot returns a revenue figure the CFO cannot reconcile.
In analytics contexts, AI agents and copilots are not generating content from nothing. They are reading from the organization’s BI estate: its reports, dashboards, certified metrics, and KPI definitions. They return what they find there. The failure mode in enterprise analytics is not fabrication. It is misinterpretation of a poorly governed source environment. The AI is doing exactly what it was designed to do. The environment it is reading from is the problem.
Applying the hallucination label to this failure pattern is not just imprecise. It directs organizations toward model-level interventions that cannot fix a governance-level condition. Teams that have spent quarters on prompt engineering, retrieval-augmented generation tuning, and model fine-tuning to address “AI hallucination” in their analytics outputs, and still cannot get consistent trusted answers, are experiencing the consequence of that misdiagnosis.
To understand the actual failure mechanism, it helps to follow a single query through an ungoverned analytics estate.
A business leader asks an AI copilot: what was our net revenue for Q2? The copilot queries the organization’s BI environment. What it finds is not one answer. It finds three versions of a metric that all carry the name “net revenue” or a close variant. The commercial team’s version excludes deferred revenue adjustments that finance applies at close. The consolidated finance version includes those adjustments but uses a different currency conversion rate than the version the regional leads rely on. A legacy SSRS report that has been in the estate since 2021 carries a third calculation that matched the old revenue recognition policy before it was updated.
The copilot has no mechanism to identify which version is certified as authoritative, because no certification exists. It has no governance rule telling it which version applies to which reporting context. It reads all three, applies whatever statistical weighting its architecture uses to reconcile conflicting sources, and returns a number. That number is not fabricated. It corresponds, in some weighted average sense, to the content of the estate it read. It also does not match any of the three versions cleanly, which is why no one in the room can reconcile it.
That is not hallucination. That is an accurate output from an AI operating against an ungoverned analytics estate. The governance failure is what produced the wrong answer. The model is a bystander.
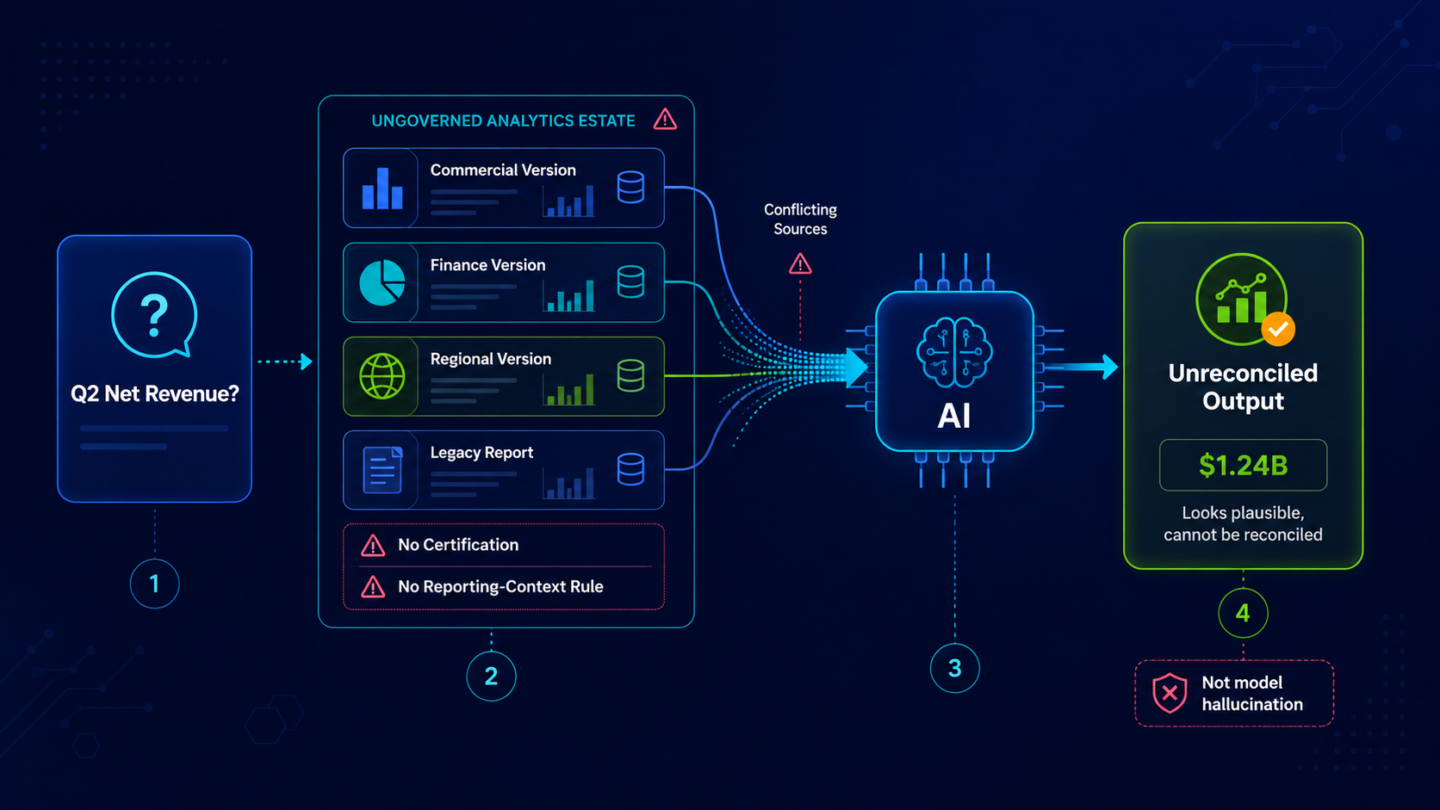
The interventions that follow an “AI hallucination” diagnosis are predictable. Better model versions. Tighter system prompts instructing the AI to use specific metric definitions. Retrieval-augmented generation designed to pull from curated source documents. Fine-tuning on domain-specific data to improve accuracy.
Each of these addresses model behavior. None of them addresses the condition that produced the problem: multiple conflicting versions of the same metric in the analytics estate, with no certification designating one as authoritative, and no relational structure governing how AI should traverse them in multi-metric reasoning.
A better model reading the same ungoverned estate does not produce a correct answer. It produces a more confident wrong answer, because the model’s increased capability allows it to synthesize the conflicting sources more fluently into a response that sounds authoritative. A tighter prompt encoding one definition of net revenue cannot account for the dozens of net revenue variants that exist in the estate and that the agent may encounter in subsequent queries or multi-step analytical tasks. Each new prompt is a patch against a specific failure. The estate continues to accumulate ungoverned variants. The patches cannot keep pace.
The fix for a governance failure is governance. Everything else is a workaround that degrades as the estate grows.
Three specific conditions in an enterprise analytics estate generate the AI trust failures that get misdiagnosed as hallucination. Each is recognizable to anyone who has managed a large BI environment.
Conflicting KPI definitions across business units. This is the most common condition and the most invisible one, because every team believes its definition is correct. Commercial uses gross revenue excluding adjustments because that is how it tracks sales performance. Finance uses net revenue including adjustments because that is what the audited P&L requires. Operations uses a volume-weighted variant that aligns with how supply chain is planned. All three definitions are named “revenue” or a variant of it in their respective dashboards. An AI agent querying across all three has no basis for choosing between them without a certification layer designating which version is authoritative for which reporting context. It synthesizes across all of them and returns an answer that matches none.
Uncertified analytics assets in the reasoning path. Enterprise BI estates accumulate reports and dashboards faster than they retire them. ZenOptics data shows that 30 to 40 percent of the typical enterprise analytics estate consists of duplicate or conflicting assets, many of which have no active owner, no certification status, and no review cycle. An AI agent cannot distinguish a certified authoritative dashboard from a shadow report a regional analyst built eighteen months ago and never updated. Both appear in the estate. Both are read with equal weight. The uncertified asset contaminates the reasoning path.
No relational structure for multi-metric reasoning. When an AI agent answers a question that spans multiple metrics, it must construct the relationships between those metrics to form a coherent answer. Without a governed relational structure, the agent builds those relationships through statistical inference, observing which metrics frequently appear together in the estate and inferring a relationship from that pattern. The analytics knowledge graph is what provides the governed path instead: a structure in which every relationship between certified metrics is encoded, maintained, and available for AI agents to follow. Without it, multi-metric answers are inference chains presented as analytical conclusions.
The same query against a governed analytics estate produces a different result. Not because the model is different. Because what the model reads is different.
The business leader asks the same question: what was our net revenue for Q2? The AI copilot queries the estate. Atlas, ZenOptics’s Analytics System of Record, has certified one version of net revenue as authoritative for commercial reporting, with the finance team’s consolidated version designated for P&L purposes. The certification record includes the metric owner, the last review date, and the specific reporting contexts each version governs. The Nexus Knowledge Graph encodes the relationship between the two versions and which context governs each.
The copilot reads the estate, follows the graph, identifies the query as a commercial reporting context, and applies the certified commercial version of net revenue. The answer it returns matches what the commercial team expects, because it came from the certified source that governs that reporting context. When the CFO asks the same question for P&L purposes, the agent applies the finance version. The answers differ, as they should, and both are traceable to certified sources.
The model is the same. The governance is different. That is the entire resolution.
This is why the analytics context layer is the infrastructure that makes AI analytics outputs trusted: it is the layer that provides the certified definitions, the ownership records, and the relational structure that AI needs to read the estate correctly rather than approximate it statistically.
Before investing in model-level remediation, three diagnostic questions identify whether the failure is a model problem or a governance problem.
Can you trace the AI’s answer to a specific analytics asset in the estate? If the answer can be traced to a specific report, dashboard, or metric definition in the BI environment, and that asset is either uncertified, outdated, or one of several conflicting versions, the failure is a governance problem. The model read what was there. If the answer has no traceable source in any analytics asset the organization has, that is a stronger signal of model-level behavior worth investigating separately.
Does the same query return inconsistent answers across sessions? Session-to-session inconsistency with the same underlying data is a governance signature. The agent is reaching different assets in an uncertified estate on each query, and weighting them differently based on which combination it encounters. Genuine model hallucination tends toward a different inconsistency pattern: generating novel content that varies in substance rather than bouncing between existing conflicting sources in a way that reflects the estate’s actual variant distribution.
Do multiple teams each recognize the answer as close to their version but not exactly right? This is the clearest governance signature of all. Each team’s variant of the metric is present in the estate. The AI synthesized across them because no certification designated one as authoritative. Each team sees a reflection of their own definition in the output but cannot reconcile it with anyone else’s. No model improvement resolves this. Designating one version as authoritative and governing the estate around that designation does.
For the organizational practice that governs the estate once the diagnosis is confirmed, analytics context engineering covers what the function looks like and where it sits in the enterprise.
The diagnosis an AI program carries shapes the conclusions leadership draws from its failures. When AI analytics outputs are attributed to model hallucination, two responses are common. The first is that the AI tools need to be replaced with more accurate alternatives. The second is that AI is not mature enough for enterprise analytics deployment, and the program should be paused until model reliability improves. Both conclusions follow logically from the hallucination diagnosis. Both are wrong when the actual failure is governance.
When the failure is correctly identified as an analytics governance problem, the path is defined, actionable, and owned by the CDO rather than dependent on model vendors. The analytics estate needs to be inventoried. Authoritative metrics need to be certified. A context and relational layer needs to be built on top of the certified estate. These are programs a data and analytics organization can execute, with clear milestones and measurable outcomes at each stage as governance coverage expands across the estate.
The reframe also changes the ROI conversation. A CDO presenting an analytics governance program as the path to trusted AI outputs is presenting a business case that leadership can fund and evaluate. A CDO asking for budget to try better models against the same ungoverned estate is presenting a bet with no clear mechanism for improvement. The distinction between data governance and analytics governance matters here: analytics governance is the specific program that addresses the layer where AI operates, and it is the program leadership needs to understand and invest in.
The organizations that produce trusted AI analytics outputs are not the ones with the most capable models. They are the ones that governed their analytics estates before demanding that AI reason across them.
What is the difference between AI hallucination and an analytics governance failure?
AI hallucination refers to a model generating plausible-sounding content with no grounding in the source data it was given. It is a documented behavior in generative language tasks. An analytics governance failure occurs when AI reads from an ungoverned analytics estate, one with conflicting metric definitions, uncertified assets, and no relational structure to govern multi-metric reasoning, and returns an output that reflects the estate’s contradictions rather than the organization’s correct business logic. The model behavior is sound in the second case. The source environment is not. The two failure modes require different fixes: model-level intervention for genuine hallucination, governance investment for analytics estate failures.
Why do enterprise AI tools return different answers to the same question across sessions?
Session-to-session inconsistency is typically a governance signature rather than a model failure. In an ungoverned analytics estate, multiple versions of the same metric coexist without certification designating which is authoritative. An AI agent querying the estate encounters different combinations of these variants on each session, depending on retrieval patterns, recency weighting, and which assets the query surface returns. The agent synthesizes a response from whichever combination it encounters. Each response reflects the estate’s content accurately. None reflects the organization’s correct business logic because no certification has established what that logic is.
Can prompt engineering fix analytics AI trust failures?
Prompt engineering addresses individual interactions by encoding specific business context into the instructions sent to the AI system. It works for controlled use cases where the metric definitions are known and the query scope is bounded. It does not scale to enterprise analytics environments where hundreds of metrics, dozens of business units, and multiple AI tools all need consistent, governed definitions. Each prompt encodes a definition for one query. The ungoverned estate continues to accumulate conflicting variants. New queries encounter those variants without the benefit of the prompt that was written for a different session. Analytics governance builds the infrastructure that eliminates the need for that patch.
What does a certified analytics estate look like, and how does it prevent AI trust failures?
A certified analytics estate is one in which every authoritative metric and report has been designated as such, with an accountable owner, a last-reviewed date, and a clear record of which reporting contexts that version governs. AI agents querying a certified estate do not encounter ambiguity about which version of a metric to use: the certification record provides the answer. Combined with the relational structure of the analytics knowledge graph, which encodes how certified metrics relate to each other and in what sequence they should be traversed for different classes of questions, a certified estate gives AI the governed foundation it needs to produce consistent, traceable outputs.
How do I know if my AI analytics problem is a model problem or a governance problem?
Three diagnostics: first, trace the AI’s answer to a specific asset in the BI estate. If it traces to an uncertified or conflicting source, that is governance. Second, check whether the same query returns inconsistent answers across sessions with the same underlying data. Session inconsistency that reflects the estate’s variant distribution is a governance signature. Third, ask multiple teams whether they recognize the AI’s output as close to but not exactly matching their version of the relevant metric. If every team recognizes a partial reflection of their variant, the AI synthesized across ungoverned definitions. None of these point to model improvement as the correct path.
Does this apply to Microsoft Copilot specifically?
Yes. Microsoft Copilot, like any AI agent or copilot, reads from the analytics environment it is connected to. When that environment contains conflicting Power BI metric definitions, uncertified reports, and no governance layer designating which KPIs are authoritative for which reporting contexts, Copilot returns answers that reflect those conflicts. Microsoft’s own documentation on Copilot readiness acknowledges that ambiguous measure names in Power BI semantic models produce ambiguous Copilot responses. The ambiguity is in the estate, not in Copilot. Governing the analytics layer that Copilot reads from, through certification, ownership, and a context layer that Copilot can trust, is what produces reliable Copilot outputs. The tool does not need to be replaced. The estate it reads needs to be governed.
Most enterprise analytics teams now understand that AI needs certified metric definitions to produce trusted outputs. That understanding has driven investment in analytics governance, metric certification programs, and context layer infrastructure. What is less understood is that a flat list of certified definitions, even a well-governed one, is not sufficient for AI to reason correctly across a complex BI estate.
When an AI agent synthesizes an answer that spans revenue, margin, churn, and volume metrics, it needs to understand how those metrics relate to each other, not just what each one means in isolation. The difference between AI that retrieves individual certified facts and AI that reasons accurately across a full analytics estate is the graph structure that encodes those relationships. That structure is the analytics knowledge graph, and it is the component of the analytics context layer that most enterprise AI deployments are missing.
Single-metric queries are the exception in enterprise analytics. “Why did operating margin compress in Q2?” requires an AI agent to traverse revenue recognition adjustments, cost of goods sold, pricing changes, and volume variances, understanding how each metric relates to the next, which version of each is certified, and in what sequence they form the answer the business is actually asking for.
Without a graph structure that encodes those relationships, the AI constructs the connections itself through statistical inference. It observes that certain metrics frequently appear together in reports and dashboards, infers a relationship, and builds its reasoning chain from that inference. The answer it produces is statistically grounded. It is not grounded in the organization’s approved business logic, and there is no governance layer in that reasoning chain that an auditor, a CDO, or a compliance function can inspect or validate.
The practical consequence is familiar to any enterprise that has deployed an AI copilot against a multi-tool BI estate: the agent produces answers that are directionally plausible, occasionally correct, and inconsistent enough across sessions that business users do not act on them without manual verification. The tool is working correctly. The relational structure it needs to reason correctly is absent.
An analytics knowledge graph is a graph structure in which every node is a certified analytics asset and every edge encodes a governed relationship between those assets. Nodes include metrics, KPIs, reports, dashboards, business processes, and the ownership records that certify each one. Edges encode the relationships that matter for AI reasoning: which metrics roll up into which KPIs, which reports draw on which certified metrics, which KPIs govern which business decisions, and who is accountable for each definition in the chain.
This is not a general-purpose knowledge graph of the kind used in search engine infrastructure or enterprise ontologies. Those graphs encode relationships between entities in the world. An analytics knowledge graph encodes relationships between certified analytics assets in this organization, governed by the policies and ownership structures this organization has established. The relationships are not derived from semantic similarity. They are derived from the actual governance structure of the analytics estate: which metrics are certified together, which ownership chains govern related KPIs, and which business processes connect specific metric definitions to specific decision workflows.
The distinction matters because two metrics that are semantically close, “gross revenue” and “net revenue” for example, may carry entirely different governance rules, entirely different ownership chains, and entirely different constraints on which AI systems are permitted to act on them and for what purpose. A graph built on semantic similarity treats them as nearly identical. An analytics knowledge graph treats them as distinct governed entities with a defined relationship that AI must navigate correctly rather than approximate statistically.
The analytics context layer captures four categories of information that AI systems need: metric definitions, relationships, ownership and certification, and process context. A flat implementation of that layer, a structured catalog of certified metric definitions with ownership records, answers the question “what does this metric mean?” correctly and completely.
It does not answer the question that multi-step agentic workflows require: how does this metric relate to every other metric that matters for this decision, and in what sequence should those metrics be traversed to produce a grounded answer?
A senior finance analyst reasoning through an operating performance question does not look up one metric at a time. The analyst holds a mental model of how the relevant metrics connect, which ones are authoritative for which purposes, and which sequence of analysis the organization has established as the approved approach for that class of question. That mental model is organizational knowledge accumulated over years. An AI agent operating without a graph structure has no access to it. It reconstructs an approximation of it from statistical patterns in the data it can see.
The analytics knowledge graph makes that organizational knowledge explicit, machine-readable, and available to every AI system that needs it. The certified sequence of metrics for an operating performance analysis is encoded in the graph. The agent follows the graph rather than reconstructing it from inference, and the answer it produces reflects the organization’s actual business logic rather than a statistical approximation of it.
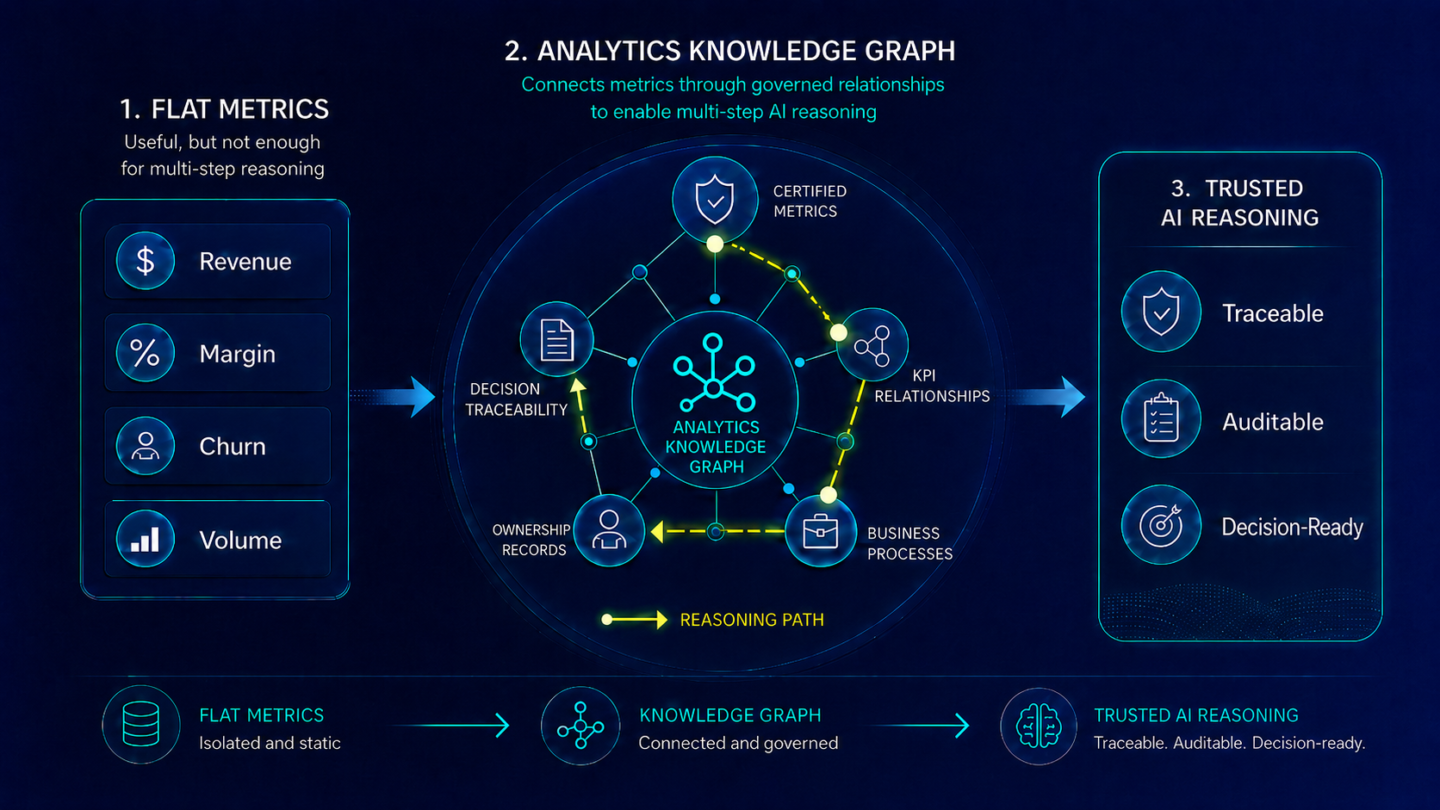
The analytics knowledge graph is frequently conflated with two existing infrastructure categories. Understanding what each one does and does not do clarifies why the graph is a distinct requirement.
A semantic layer maps technical data field names to business-readable metric names and pre-computes standard calculations. It handles the translation between the data warehouse and the BI tool. It does not encode the governance relationships between metrics, the ownership chains that certify them, or the process context that determines how AI systems should traverse them. The distinction between the analytics context layer and the semantic layer covers this in full. The knowledge graph is the relational structure built on top of the context layer: it requires the semantic layer as a foundation and extends well beyond it.
A data catalog documents raw data assets: tables, schemas, fields, data quality records, and technical lineage from source to destination. It operates at the infrastructure layer. An analytics knowledge graph operates at the analytics layer, encoding relationships between the certified business metrics and KPIs that sit on top of the data infrastructure. The catalog tells data engineers what data exists. The knowledge graph tells AI agents how certified analytics relate to each other within the organization’s governance structure.
Nexus, ZenOptics’s AI Context Layer for Analytics, is organized around three capabilities: Metadata Onboarding, the Semantic Curation Studio, and the Knowledge Graph. The Knowledge Graph is the relational layer built on top of the certified analytics estate that Atlas governs.
It is not manually constructed. Enterprise analytics estates contain decades of accumulated business knowledge embedded in their existing BI metadata: report hierarchies, dashboard structures, metric dependencies, KPI roll-up logic, usage patterns, and ownership records. The Modern analytics knowledge graph platforms can derive relationships from existing BI metadata, reducing the need for extensive manual modeling.
The graph is maintained continuously. As the analytics estate evolves, as new metrics are certified, existing ones retired, and BI tools added or replaced, the graph updates to reflect the current state of the certified estate rather than its historical approximation. This is the same principle that governs the context layer overall: a static, manually constructed artifact decays as the business changes. A continuously maintained graph derived from live BI metadata stays current.
Three AI capabilities become available when AI agents operate against the Nexus Knowledge Graph rather than a flat context layer.
The first is multi-hop metric reasoning. An agent answering a multi-metric business question traverses the graph along governed edges rather than constructing the reasoning chain through statistical inference. Each step in the reasoning follows a relationship that the organization has certified, not a relationship the agent inferred from co-occurrence patterns.
The second is conflict detection. When two metrics in the same reasoning chain carry conflicting definitions, the graph surfaces the conflict before the agent incorporates both into its answer. Without the graph, the agent has no mechanism to detect that a conflict exists. It synthesizes a response from both definitions and produces an answer that is internally inconsistent in ways that are hard to diagnose after the fact.
The third is decision traceability. When an AI agent’s recommendation can be traced node by node through the knowledge graph, from the decision back through the KPIs that informed it, through the certified metrics those KPIs are built on, to the ownership and certification records that validate each one, the trace is complete, auditable, and available to compliance and risk functions without manual reconstruction. The governance that analytics context engineering establishes is what makes the graph traceable. The graph is what makes the trace machine-readable at scale.
Decision traceability for enterprise AI requires more than the ability to log what an agent did. It requires the ability to trace why the agent produced the output it did, grounded in the specific certified analytics that informed each step of its reasoning.
A knowledge graph is the infrastructure that makes that traceability structural rather than reconstructed. When the reasoning chain is encoded in a governed graph, the trace exists as a property of the graph itself. Every node the agent traversed, every edge it followed, every certified metric it applied is recorded in the graph structure. The compliance function does not reconstruct the trace from logs. It reads the trace from the graph.
This is also what separates governed AI execution from capable AI execution. Agentic analytics deployments that reach production share a common characteristic: the reasoning the agent performs is grounded in a certified, traceable structure that the organization controls. The analytics knowledge graph is that structure. It is what allows enterprises to extend AI agents into consequential decision workflows, not because the agent is more capable, but because the reasoning it performs can be verified, audited, and governed.
What is an analytics knowledge graph?
An analytics knowledge graph is a graph structure in which nodes represent certified analytics assets (metrics, KPIs, reports, business processes, ownership records) and edges represent governed relationships between those assets. It encodes the relational structure of the analytics estate so that AI agents can reason across multiple metrics in sequence, following certified governance logic rather than constructing relationships through statistical inference. It is the component of the analytics context layer that makes cross-metric AI reasoning accurate and auditable.
How is an analytics knowledge graph different from a semantic layer?
A semantic layer translates technical data field names into business-readable metric names and pre-computes standard calculations. It handles query-time translation between the data warehouse and BI tools. An analytics knowledge graph encodes the governance relationships between certified metrics: which KPIs connect to which business decisions, which metrics carry the same name but different definitions across business units, which ownership chains certify each metric, and in what sequence metrics should be traversed for a given class of question. The semantic layer is a prerequisite; the knowledge graph extends beyond it into the relational governance structure of the certified analytics estate.
Why do AI agents need a graph structure rather than a flat list of metric definitions?
A flat list of certified definitions enables AI to answer single-metric questions accurately. Multi-step analytical questions require the agent to traverse relationships between metrics in sequence, applying the correct certified definition at each step and maintaining consistency of business logic across the full reasoning chain. Without a graph that encodes those relationships, the agent constructs them through statistical inference, producing answers that are plausible but not grounded in the organization’s approved analytical logic. The graph is what makes multi-metric AI reasoning governable rather than approximate.
Is the analytics knowledge graph built manually?
Not with ZenOptics. The Nexus Knowledge Graph is derived automatically from the BI metadata that already exists within the organization’s analytics estate: report hierarchies, dashboard structures, metric dependencies, usage patterns, and ownership records. The graph reflects the actual governance relationships encoded in the estate rather than a theorized specification constructed from scratch. It is also maintained continuously as the estate evolves, so the graph stays current without requiring periodic rebuild cycles.
What does decision traceability look like in a knowledge graph structure?
When an AI agent reasons through a business question using the knowledge graph, every step of its reasoning follows a governed edge between certified nodes. The trace from the agent’s recommendation back to the certified metrics that informed it is encoded in the graph structure itself. Compliance and risk functions read the trace from the graph rather than reconstructing it from logs. This is what makes AI-influenced decisions auditable at scale: the governance structure of the reasoning is a property of the graph, not a post-hoc reconstruction from the agent’s output.
How does the Nexus Knowledge Graph connect to Atlas?
Atlas is ZenOptics’s Analytics System of Record: it inventories the analytics estate across BI tools, certifies authoritative metrics and reports, assigns ownership, and maintains the governance records for the full estate. The Nexus Knowledge Graph is built on top of that certified estate. Atlas produces the certified nodes (each metric, KPI, report, and ownership record) that the graph connects. Nexus derives the relational structure from the metadata Atlas governs and makes the graph machine-readable for AI agents and agentic workflows. The two systems together produce a certified, relational, continuously maintained analytics context layer.
How does the knowledge graph change the time required to deploy new AI use cases?
Without a knowledge graph, each new AI use case requires manual specification of the metric relationships the agent needs to navigate: which KPIs connect to which decisions, which metrics are authoritative for which reporting context, and what sequence the agent should follow. That specification work happens once per use case and must be repeated when the business or the BI estate changes. With the Nexus Knowledge Graph in place, the relational structure is already derived and maintained. New AI use cases deploy against the existing graph rather than requiring new specification work, which compresses deployment timelines two to three times, consistent with what organizations implementing ZenOptics typically see once the context layer is in place.
Most enterprise AI programs are built on a data governance foundation. Organizations have invested in data catalogs, data quality frameworks, metadata management, lineage tracking, and data stewardship programs. When AI deployments underperform or produce outputs that are inconsistently trusted, data governance is often the first program leaders review. Strengthening it is a common first response.
In most cases, strengthening data governance does not fix the AI trust problem. The reason is that the problem is not at the data governance layer. It is at the analytics governance layer, a distinct program that governs how metrics are defined, certified, owned, and made available to AI systems. Most enterprises have the first program and have not built the second. That gap is where analytics AI investments stall.
Data governance addresses the infrastructure layer: the raw data, pipelines, schemas, and datasets that form the foundation of enterprise analytics. A mature data governance program establishes clear ownership for data assets, enforces data quality standards at the record level, manages data lineage from source to destination, and ensures compliance with data handling requirements. These are the programs that ensure clean, accessible, well-documented data is available to the analysts and tools that need it.
Data governance operates at the level of data: tables, schemas, records, fields, and the policies that govern how they are maintained and used. Its primary audiences are data engineers, data platform teams, compliance functions, and the governance roles responsible for data quality and data privacy.
Data governance is necessary infrastructure. Without it, enterprise AI has no reliable data foundation. Organizations that have not built data governance programs face data quality problems that propagate into AI outputs and are difficult to diagnose. A mature data governance program is a prerequisite for reliable AI.
It is not sufficient on its own. Data governance answers the question of whether the data is accurate and well-maintained. It does not answer the question that determines whether AI outputs are trusted: whether the metrics and KPIs that AI acts on are defined consistently, certified as authoritative, and governed at the analytics layer where business decisions are made.
Analytics governance operates at the analytics layer: the dashboards, reports, KPIs, and certified metrics that business users and AI systems use to make decisions. Its scope is distinct from data governance in both the assets it governs and the questions it answers.
Where data governance manages raw data quality, analytics governance manages analytics asset quality: whether reports are certified as authoritative, whether KPI definitions are consistent across business units, whether metrics have active owners who are accountable for their definitions, and whether the analytics assets available to AI systems are trustworthy enough to ground AI recommendations and actions.
Where data governance tracks data lineage from source to table, analytics governance tracks decision lineage from metric to recommendation to outcome: ensuring that every AI-driven action can be traced back to the certified analytics that informed it.
Where data governance enforces data handling policies, analytics governance enforces usage policies for certified analytics: which AI systems can act on which metrics, what process governs each use, and what documentation is required for AI-influenced decisions.
For a detailed treatment of analytics governance in the context of AI agent deployment, Governing Autonomous Analytics AI at Enterprise Scale covers the governance requirements specific to AI agents operating in analytics environments.
In most enterprise organizations, the data governance program and the analytics governance program are not formally separated. Data governance typically expands over time to include some governance of analytics assets, but the expansion is usually incomplete: certification processes are inconsistent, KPI ownership is informal, and the governance of what AI can act on is either absent or handled case-by-case.
This gap becomes visible in AI deployments in a predictable way. The AI tool has access to well-governed data: accurate, documented, lineage-tracked. When the tool queries a business metric, it finds multiple versions of the same metric with the same name, because data governance does not resolve the question of which version is authoritative for analytics purposes. It finds metrics without clear business definitions, because data governance documents technical fields rather than the business meaning those fields carry. It finds no mechanism for knowing whether a metric is currently in active use, who owns its definition, or what governance rules apply when an AI system acts on it.
The data governance layer is sound. The analytics governance layer is absent. The AI outputs are inconsistent. Organizations implementing ZenOptics typically find that 30 to 40 percent of their analytics estate consists of duplicate or conflicting reports, assets that data governance has not reached because its scope ends at the data level. Resolving this requires a governance program that addresses the analytics layer specifically.
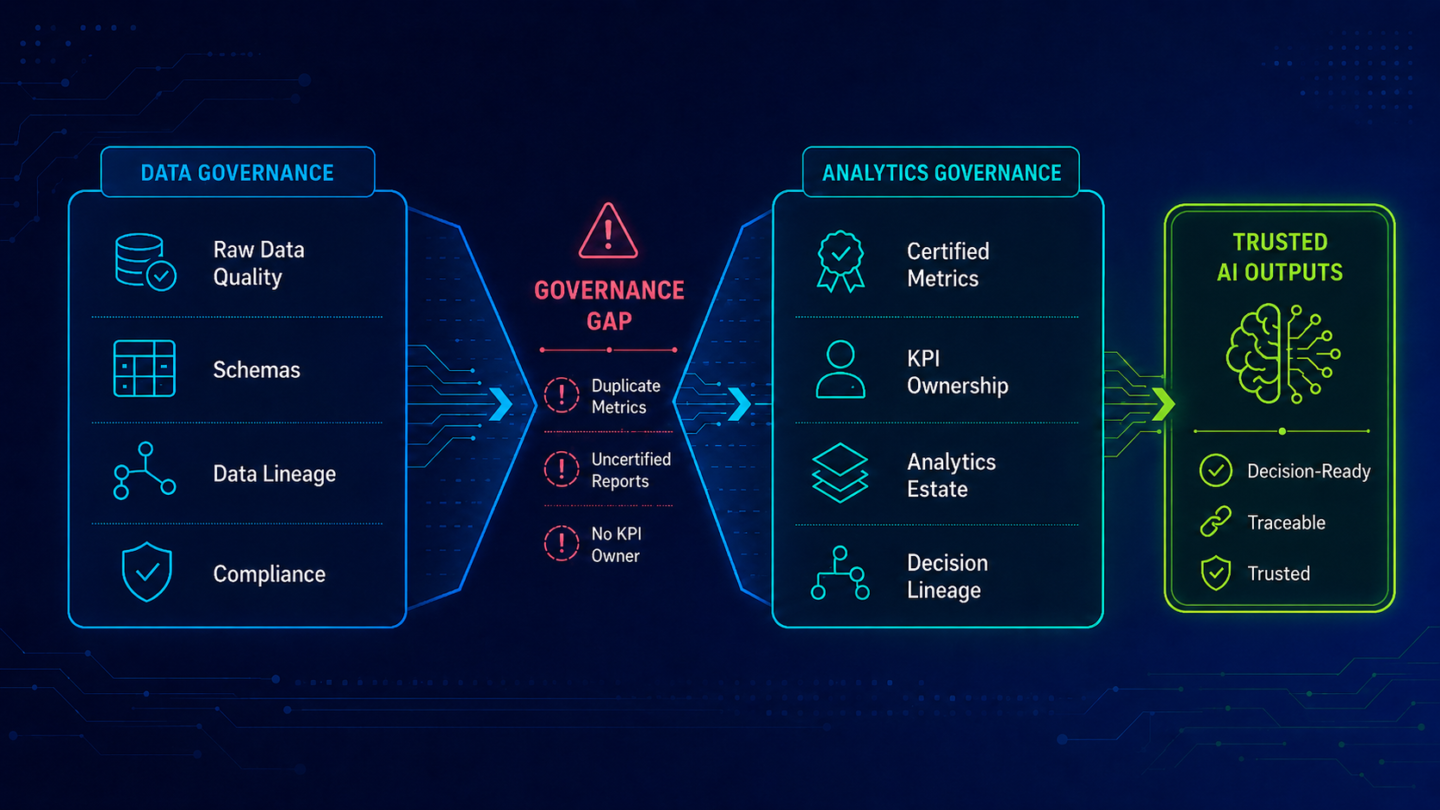
The distinction between data governance and analytics governance is not a positioning claim. It is a market reality that Gartner has formally recognized. In 2025, Gartner published a Magic Quadrant specifically for “Data AND Analytics Governance Platforms,” an expansion that explicitly treats analytics governance as a named category alongside but distinct from data governance. The 2026 coverage expanded further, validating that enterprise organizations are seeking governance solutions that address the analytics layer in ways that existing data governance platforms do not.
The Gartner category separation reflects what enterprise buyers have been discovering in practice: data governance platforms that excel at raw data quality, lineage, and compliance do not provide the certified metrics governance, KPI ownership frameworks, and analytics-specific AI readiness that the analytics layer requires. These are different programs, different tools, and different organizational capabilities.
Running both programs does not require duplication of effort. Data governance and analytics governance address different layers and use different inputs. They are complementary, not competing.
Data governance owns the infrastructure layer: data quality, schema documentation, data lineage, and data handling compliance. Its inputs are raw data systems, pipelines, and schemas. Its outputs are clean, documented, policy-compliant data.
Analytics governance owns the meaning layer: metric certification, KPI definition ownership, analytics estate inventory, and the governance of what AI systems can act on. Its inputs are BI tools, analytics assets, and the business definitions that determine what certified metrics mean. Its outputs are a trusted, certified analytics estate with clear ownership, consistent definitions, and the governance infrastructure that AI systems need to produce reliable outputs.
Where the two programs connect is at the boundary between clean data and meaningful analytics: data governance ensures the underlying data is accurate; analytics governance ensures that the business metrics built on that data are defined correctly, certified as authoritative, and governed appropriately for AI use. Both are required for enterprise AI that produces trusted intelligence.
The analytics governance program also connects directly to the analytics context layer: the machine-readable representation of certified business meaning that AI systems consume. Analytics governance is the practice; the analytics context layer is what that practice produces.
Atlas, ZenOptics’s Analytics System of Record, is the foundation for analytics governance. Atlas continuously inventories analytics assets across the enterprise’s BI tools, establishes and maintains certification records for authoritative metrics and reports, assigns and tracks ownership of every analytics asset, and monitors the estate as it evolves. The governance program Atlas supports is analytics governance, not data governance, and not a replacement for the data governance programs organizations already have.
Nexus, ZenOptics’s AI Context Layer for Analytics, translates the certified analytics estate that Atlas governs into machine-readable business context that AI systems can consume. The context layer Nexus generates is the bridge between analytics governance practice and AI deployment readiness: it takes the certified definitions, ownership records, and KPI relationships that Atlas governs and makes them available to AI tools, copilots, and agents, grounding every AI output in the organization’s certified business logic rather than statistical inference.
Together, Atlas and Nexus operationalize the analytics governance layer: the one that data governance programs do not reach, that Gartner has formally recognized as a distinct category, and that determines whether enterprise AI produces inconsistent outputs or trusted intelligence.
What is the difference between data governance and analytics governance? Data governance manages the infrastructure layer: raw data quality, schema documentation, lineage, and data handling compliance. Analytics governance manages the analytics layer: whether business metrics are certified as authoritative, whether KPI definitions are consistent across teams, whether AI systems can act on analytics assets with appropriate governance, and whether AI-influenced decisions are traceable. The two programs address different layers and require different tools and practices, though they are complementary rather than competing.
Can data governance replace analytics governance? No. Data governance addresses raw data and infrastructure; analytics governance addresses certified metrics and the business intelligence layer. Organizations with strong data governance but no analytics governance typically find that their AI tools have access to well-managed data but inconsistent business metric definitions, uncertified analytics assets, and no governance framework for what AI systems can act on. The gap between clean data and trusted AI outputs is where analytics governance operates.
Why does enterprise AI need analytics governance specifically? Enterprise AI operates primarily at the analytics layer: it queries business metrics, synthesizes KPI data, and influences decisions based on certified analytics. For those outputs to be trusted, the analytics layer must be governed: metrics must be certified, definitions must be consistent, and AI actions must be traceable to authoritative sources. Data governance ensures the underlying data is accurate; analytics governance ensures the business metrics built on that data are defined and governed correctly for AI use.
Has Gartner recognized analytics governance as a distinct category? Yes. In 2025, Gartner published a Magic Quadrant for “Data AND Analytics Governance Platforms,” explicitly treating analytics governance as a named, distinct category alongside data governance. The 2026 expansion of coverage validated that enterprise buyers are seeking governance solutions that address the analytics layer specifically, in ways that data-only governance platforms do not provide.
How do data governance and analytics governance programs connect? They connect at the boundary between raw data and business analytics. Data governance ensures the underlying data is accurate, documented, and policy-compliant. Analytics governance ensures the metrics built on that data are certified as authoritative, consistently defined, and appropriately governed for AI use. The output of data governance (clean, documented data) is the input to the analytics estate that analytics governance then governs. Both programs must be in place for enterprise AI to produce outputs that are both accurate at the data level and trusted at the business level.
What does an analytics governance program require that data governance does not? Analytics governance requires four capabilities that are typically outside data governance scope: systematic certification of analytics assets (designating which version of each metric is authoritative), KPI definition ownership (assigning an accountable human to every certified metric’s business definition), analytics estate inventory (continuous visibility into all BI assets across tools), and AI readiness governance (clear policies for which AI systems can act on which certified metrics and under what conditions). Data governance frameworks rarely address any of these four at the analytics layer.
Enterprise organizations have invested heavily in two engineering disciplines to support their AI programs. Data engineering builds and maintains the infrastructure that stores, moves, and transforms data. Prompt engineering crafts the queries and instructions that help AI systems produce better outputs for specific tasks. Both are necessary. Neither addresses the foundational requirement that makes AI outputs trusted across an enterprise: structured, governed, continuously maintained business meaning that AI systems can consume reliably.
Analytics context engineering is the discipline that fills that gap. It is the practice of structuring the business meaning behind enterprise metrics, governing that meaning with ownership and certification, and maintaining it continuously so that AI systems can act on it with accuracy and auditability. Without it, AI tools have access to data but not to understanding. Prompt engineering patches individual queries; analytics context engineering builds the infrastructure that eliminates the need for the patch.
The context gap is the most consistently cited reason analytics AI investments stall in enterprise environments. Organizations deploy AI tools against their BI estate, the tools connect successfully, and the outputs are still not trusted. Teams find that AI answers are sometimes right, sometimes plausible-but-wrong, and rarely consistent enough to be acted on without manual verification.
The diagnosis is almost always the same: the AI tool has access to data but not to the organizational meaning behind it. It does not know which version of a metric is authoritative. It does not know how a KPI is defined in this business unit versus that one. It does not know who owns a metric’s definition, whether it has been reviewed recently, or what process governs decisions made with it. The AI fills those gaps with statistical inference, producing outputs grounded in statistical inference rather than in what the organization has decided its metrics mean.
Data engineering does not address this gap. Data engineering governs infrastructure: pipeline reliability, schema integrity, data quality at the record level. It ensures data arrives correctly. It does not ensure that metrics are interpreted correctly.
Prompt engineering does not address this gap either. A well-crafted prompt can instruct an AI system to use a specific metric definition for a specific query. That approach works in a controlled context for a known question. It does not scale across an enterprise where hundreds of metrics, dozens of teams, and multiple AI tools need consistent, governed business context that no prompt can encode comprehensively.
Analytics context engineering addresses the gap directly. It is the discipline responsible for making the organization’s business meaning machine-readable, kept current, and available to every AI system that needs it.
Analytics context engineering is not a single task. It is an ongoing operational practice with three core activities.
The first is automated context generation: extracting the business meaning that already exists within the organization’s BI metadata and structuring it so AI systems can consume it. Enterprise analytics estates contain decades of accumulated business knowledge: metric definitions embedded in report logic, KPI relationships encoded in dashboard hierarchies, ownership patterns visible in certification records and usage data. Analytics context engineering surfaces and formalizes that knowledge rather than constructing it from scratch.
The second is governance: establishing and maintaining the certification, ownership, and review cycles that determine which business definitions are authoritative, who is responsible for them, and how conflicts are resolved when multiple definitions exist for the same term. This is not a one-time exercise. Analytics context engineering treats the context layer the way data engineering treats the data warehouse: as a living system that requires ongoing maintenance to remain reliable.
The third is activation: making the structured business context available to AI systems in a machine-readable format, and integrating it with the BI tools, AI agents, and agentic workflows that need to act on certified business intelligence. Activation includes connecting the context layer to specific AI use cases, verifying that AI outputs reflect the governed definitions rather than statistical inference, and monitoring the context layer for gaps as the business evolves.
Together, these three activities produce what an analytics context layer is: the machine-readable, continuously governed representation of what enterprise metrics mean. Analytics context engineering is the discipline that builds and maintains it.
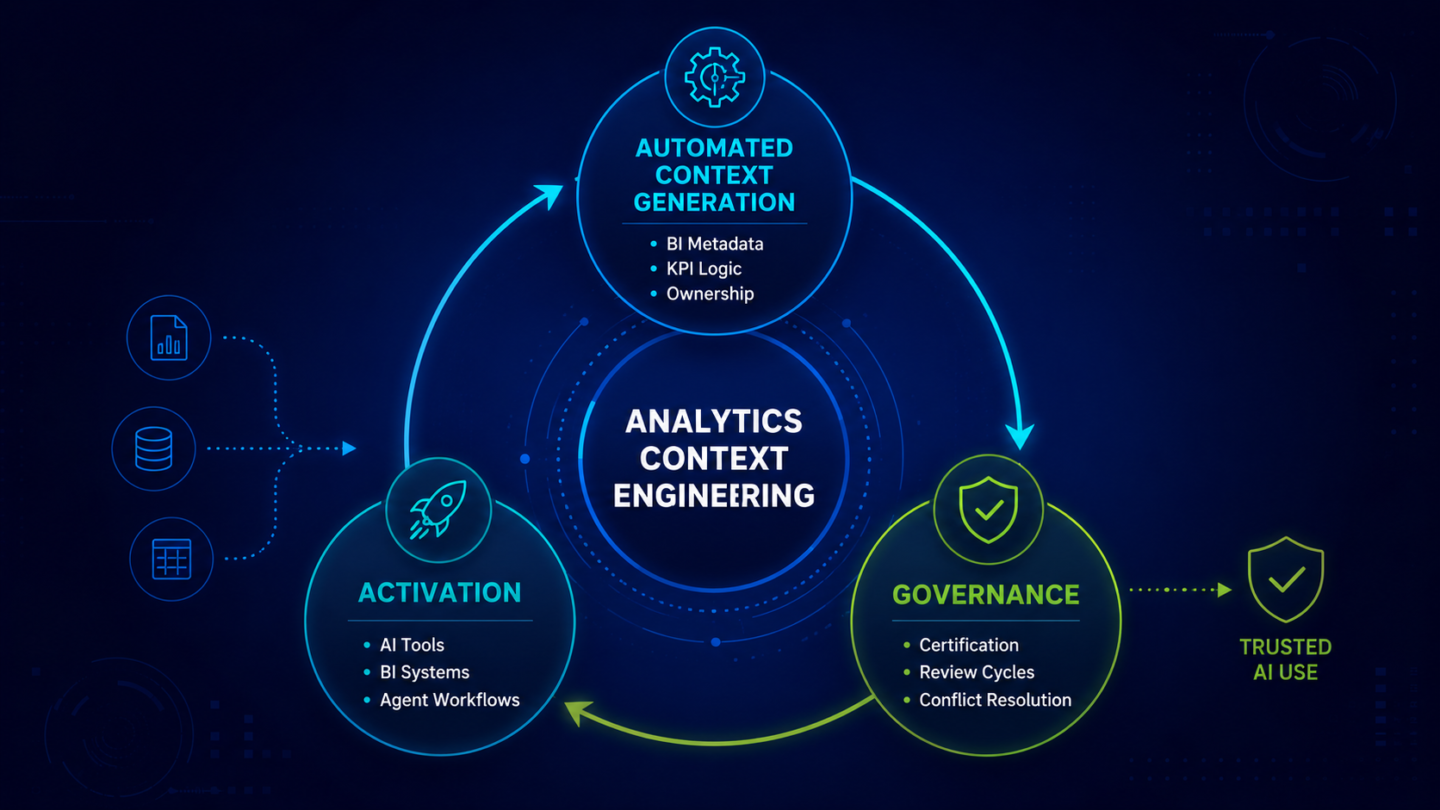
Data engineering and analytics context engineering address fundamentally different problems. Understanding the distinction matters because organizations that treat context engineering as a data engineering responsibility consistently produce incomplete results.
Data engineering governs the technical layer: whether data arrives in the warehouse correctly, whether schemas are consistent, whether pipelines are reliable, whether data quality at the record level meets defined standards. The question data engineering asks is whether the data is accurate.
Analytics context engineering governs the meaning layer: whether metrics are defined consistently across teams, whether the definitions are current and certified, whether AI systems applying those definitions will produce outputs aligned with the organization’s business logic, and whether the decisions AI influences are traceable to authoritative sources. The question analytics context engineering asks is whether the data is understood correctly.
An organization with strong data engineering and no analytics context engineering has accurate data that AI interprets inconsistently. The infrastructure is correct; the meaning is ungoverned. The outputs are plausible and unreliable.
The full distinction between the analytics context layer and infrastructure-level approaches is covered in detail in Analytics Context Layer vs. Semantic Layer.
Prompt engineering has a defined and legitimate role in AI deployment: crafting the instructions that guide individual AI interactions toward more accurate and useful outputs. For specific, controlled use cases with known inputs and well-understood business context, prompt engineering is effective.
It does not scale to enterprise analytics for three reasons.
First, the enterprise analytics environment is too large and too varied for comprehensive prompt encoding. A single organization might have thousands of metrics, hundreds of reports, dozens of business units with variant definitions, and multiple AI tools that need consistent business context. No set of prompts can encode all of that comprehensively, keep it current, or apply it consistently across every query and every AI system.
Second, prompts do not persist. The business context embedded in a prompt exists for the duration of that interaction. When the next query is run, the prompt must re-encode the same context. When a metric definition changes, every related prompt must be updated. When a new AI tool is added to the stack, its prompts must be constructed from scratch.
Third, prompts do not produce auditability. A governed analytics context layer makes AI actions traceable to certified business definitions. A prompt does not. Organizations operating under compliance or audit requirements cannot satisfy them with prompt-based context alone.
Analytics context engineering builds the infrastructure that replaces these workarounds: a persistent, governed, machine-readable context layer that every AI tool in the organization’s stack can consume, and that stays current as the business evolves.
Analytics context engineering as a discipline is defined by three operational practices that distinguish it from adjacent functions.
Automated context generation. Rather than building the business context layer from scratch, analytics context engineering derives it from the BI metadata that already exists: the report structures, metric definitions, ownership records, certification status, and usage patterns that accumulate within the analytics estate over time. This approach produces a context layer that reflects actual organizational usage rather than a theorized specification, and that can be maintained continuously rather than rebuilt periodically.
Governance through ownership cycles. Every element of the context layer (every metric definition, every KPI relationship, every certification record) is owned by an accountable person and subject to a defined review cycle. Analytics context engineering establishes and enforces those ownership and review processes, ensuring that the context layer reflects the organization’s current business logic rather than its historical approximation.
Continuous sync with the analytics estate. The context layer must stay current as the organization evolves: as new metrics are added, old ones retired, definitions revised, and BI tools changed. Analytics context engineering treats the context layer as a continuously maintained system rather than a point-in-time deliverable, with automated mechanisms to detect changes in the underlying BI estate and surface them for review and update.
Nexus, ZenOptics’s AI Context Layer for Analytics, automates the first and third of these practices: it derives the context layer from existing BI metadata and maintains it continuously as the estate changes. The governance practice in the middle (ownership assignment, certification, and review) is where the analytics context engineering function within the organization sets the policies that Nexus enforces.
Analytics context engineering is an emerging function. In organizations that have defined it explicitly, it sits at the intersection of three existing functions: analytics operations (which manages the BI estate), data governance (which manages ownership and certification policies), and AI program leadership (which owns AI deployment readiness and outcomes).
In smaller analytics organizations, analytics context engineering is typically a responsibility held by the Head of Analytics or Director of BI, often in close coordination with the data governance function. In larger organizations, dedicated analytics ops or analytics engineering teams take ownership of the derivation and maintenance practices, with governance policies set by the data governance office.
The function does not require a new department. It requires a defined owner for the analytics context layer, a clear process for deriving and governing business definitions, and the tooling to automate derivation and continuous sync. Organizations implementing ZenOptics typically see analytics discovery improve 20 to 40 percent and AI deployment timelines compress two to three times once the analytics context engineering function is established and the context layer is in place, because AI teams can deploy against a trusted, governed foundation rather than building context from scratch for each new use case.
What is analytics context engineering? Analytics context engineering is the discipline of structuring, governing, and continuously maintaining the business meaning behind enterprise metrics so that AI systems can consume it reliably. It covers three core practices: deriving the context layer from existing BI metadata, governing it through ownership and certification cycles, and maintaining it continuously as the analytics estate evolves. It is the function that builds and maintains the analytics context layer that AI tools need to produce trusted, business-grounded outputs.
How is analytics context engineering different from data engineering? Data engineering governs the technical infrastructure layer: pipelines, schemas, data quality at the record level. It ensures data arrives correctly. Analytics context engineering governs the meaning layer: how metrics are defined, who owns those definitions, how they relate to each other in a governed hierarchy, and whether AI systems will interpret them correctly. Both are required for enterprise AI; they address different problems and require different practices.
Why can’t prompt engineering replace analytics context engineering? Prompt engineering addresses individual AI interactions by encoding business context into the instructions sent to AI systems. It works for specific, controlled use cases but does not scale to enterprise analytics: prompts cannot encode the full complexity of an enterprise’s metric definitions, cannot keep that context current automatically, and do not produce the auditability that compliance requirements demand. Analytics context engineering builds the persistent, governed infrastructure that eliminates the need to re-encode business context in every prompt.
Who owns analytics context engineering in a typical enterprise? In most enterprises, analytics context engineering sits at the intersection of analytics operations, data governance, and AI program leadership. In smaller organizations, it is typically owned by the Head of Analytics or Director of BI. In larger organizations, dedicated analytics engineering or analytics ops teams take responsibility for the derivation and maintenance practices, with governance policies set by the data governance function. The function does not require a separate department. It requires a defined owner and a clear process.
How does analytics context engineering connect to the analytics context layer? The analytics context layer is the output that analytics context engineering produces and maintains. The context layer is the machine-readable, structured representation of what enterprise metrics mean. Analytics context engineering is the discipline responsible for building that layer from existing BI metadata, governing it so it stays authoritative, and integrating it with the AI tools and agentic workflows that need to consume it.
What tools support analytics context engineering? Analytics context engineering requires tooling that can derive business context automatically from BI metadata, manage certification and ownership workflows, and maintain the context layer as the analytics estate changes. ZenOptics Nexus is built for this purpose: it onboards BI metadata, automatically derives the analytics context layer, and maintains it continuously through integration with the certified analytics estate managed by Atlas. The combination gives analytics context engineering teams the automated derivation and sync capabilities that manual approaches cannot provide at enterprise scale.