




Most large enterprises have at least one: a SharePoint site, an internal .NET application, or a custom intranet page built to organize analytics access across BI tools. These systems solved a real problem. Across organizations running Power BI, Tableau, SAP Business Objects, and Qlik in parallel, business users needed a single place to find reports without knowing which tool produced them. The portal solved the discovery problem. It did not solve the governance problem. As enterprise AI deployments have accelerated through 2026, the difference between those two problems has become urgent.
Why Enterprises Built Analytics Portals
The analytics portal emerged as a reasonable response to a fragmented BI environment. By the late 2010s, most large enterprises operated three or more BI tools simultaneously. Power BI and Tableau held different teams. SAP Business Objects served finance. Qlik ran in operations. Legacy reports lived in SSRS. Each tool maintained its own catalog, its own access model, and its own search experience. A business analyst looking for the Q3 revenue report had no way to know which tool to open first.
The portal answered this: one interface surfacing content from all tools. SharePoint pages were the most accessible build option; most enterprises already had SharePoint, already had IT teams who knew it, and could stand up a basic reports directory without a new procurement cycle. .NET portals offered more control for organizations with development resources. Custom intranets provided embedded access and role-based filtering for enterprises with diverse user populations.
These systems worked well enough for what they were designed to do. They organized content. They reduced search friction for frequent users. They gave analytics teams a mechanism to publish updates and direct traffic to authoritative reports. The design decision was sound for the problem it addressed.
That problem was discovery, not governance. For most of the past decade, solving discovery was enough. The distinction matters enormously now.
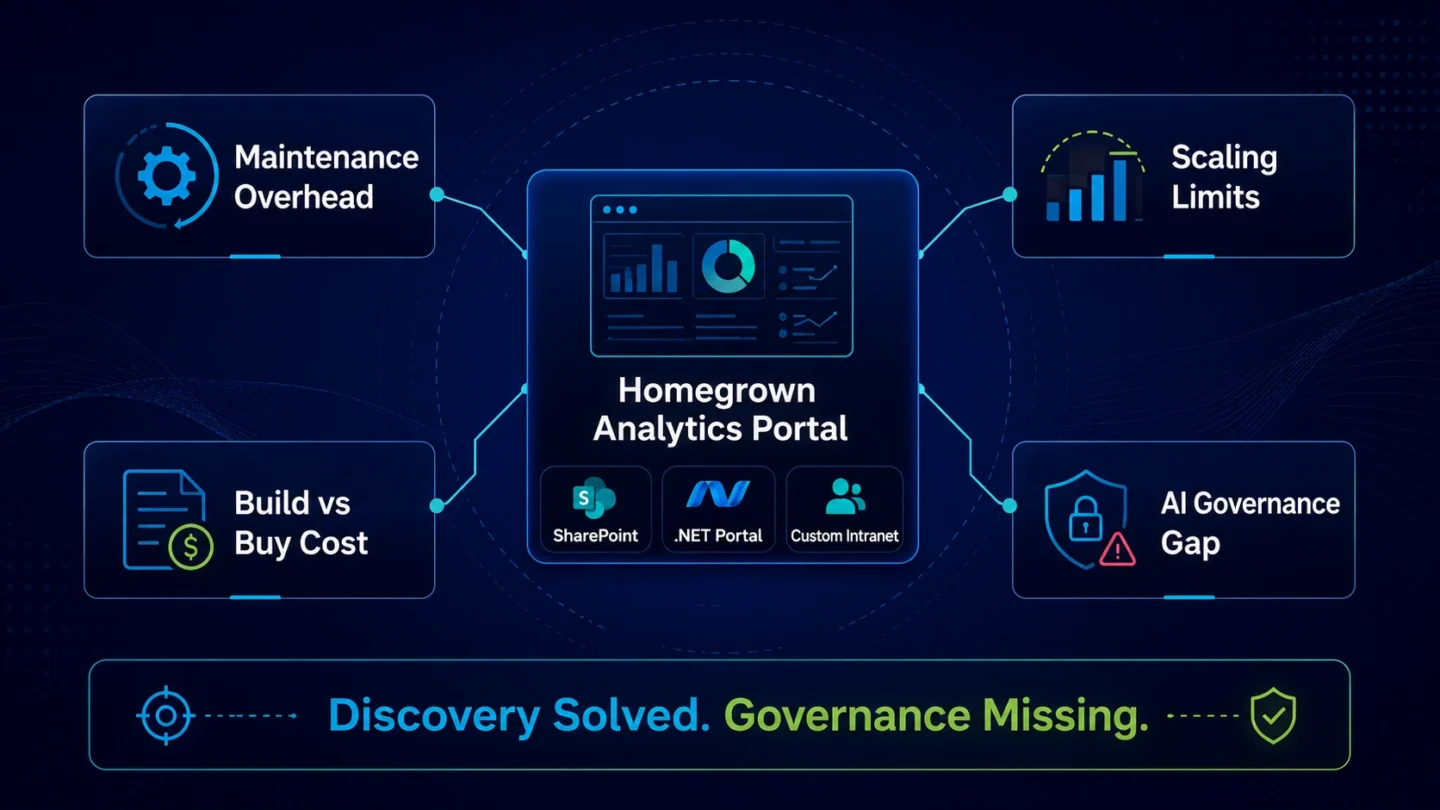
Four Ways Homegrown Analytics Portals Are Failing Enterprise Teams
Maintenance overhead that compounds over time
A homegrown analytics portal is a maintenance commitment, not a one-time build. Every BI tool update can break portal integrations. Every new report category requires manual portal updates. When the portal was originally built, the person who built it understood the architecture. When that person leaves, the knowledge goes with them. Many organizations that built SharePoint analytics portals in 2018 are now maintaining systems designed for a smaller BI estate, staffed by teams who were not involved in the original build. The Hidden Cost of Maintaining a Homegrown Analytics Portal covers this cost structure in detail.
Scaling limits that appear earlier than expected
A portal designed for 500 users across three BI tools behaves differently at 5,000 users across eight tools. Performance degrades. Navigation structures that worked for 200 reports become unmanageable at 2,000. Role-based access logic that was simple at launch requires constant manual updates as organizational structures shift. The scaling problem is not always a technology problem; it is frequently an architectural one. A portal built on SharePoint lists or a custom .NET data model was not designed to manage a live, continuously-growing analytics estate. When Does a Homegrown Analytics Portal Stop Scaling? examines where the inflection points typically occur.
Build vs. buy economics that shift as requirements grow
The initial build decision often rests on a cost comparison that favors building: no licensing cost, internal development resources available, a scoped deliverable. What that comparison frequently underestimates is the ongoing cost of keeping a custom-built system current. As requirements expand to include new BI tool connectors, mobile access, certification workflows, and AI integration, the maintenance cost compounds. Build vs. Buy: The Business Case for Modern Analytics Portals runs the full cost comparison, including the categories most internal build assessments miss.
AI that cannot read from an ungoverned portal
This is the failure mode that has made the others urgent. Enterprise AI copilots and agents do not query a portal's navigation structure. They read from the analytics estate: the reports, dashboards, KPI definitions, and certified metrics that sit above the data layer. A portal that organizes access to those assets does not certify them, does not define metric ownership, and does not encode the business logic AI needs to return a trusted answer. When an AI agent queries a portal-backed analytics estate, it locates assets; it cannot determine which version of revenue is authoritative. The result is conflicting outputs that require manual reconciliation before they can inform a business decision. Why AI Breaks Traditional Analytics Portals covers the specific architectural reasons.
The Structural Problem Modernization Cannot Fix
The instinct when a portal fails is to treat analytics portal modernization as a user experience challenge: better search, updated navigation, a cleaner interface, improved mobile access. These address real user experience problems. They do not address the failure mode that matters most in 2026.
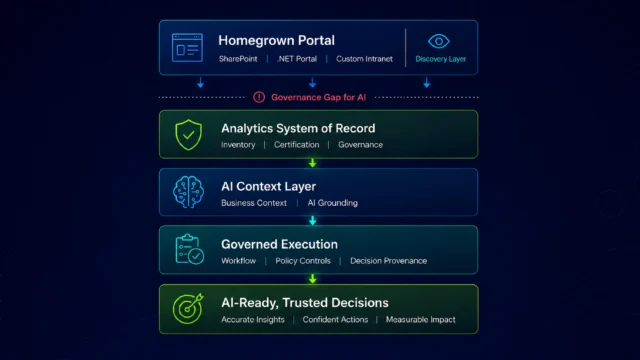
A portal is a distribution layer. Its architectural role is to organize and surface analytics assets that already exist. It does not determine which of those assets is authoritative. It does not assign ownership to a KPI definition. It does not resolve the inconsistency between "revenue" as defined in the Power BI sales dashboard and "revenue" as defined in the Tableau finance report. It cannot encode the business logic an AI agent needs to follow reasoning rather than approximate it. (This distinction is worth making explicitly: a portal can be well-designed and widely used, while remaining completely opaque to AI at query time.)
Modernizing the portal interface does not close this gap. A more navigable SharePoint page is still a distribution layer. A redesigned .NET portal adds better search; the underlying limitation does not change. The gap is not in the interface; it sits in the governance infrastructure the portal was never designed to provide.
The Hidden Cost of an Ungoverned Analytics Estate documents what organizations pay for this gap: reconciliation cycles after every AI output, duplicated reports that inflate certification costs, and AI deployments that require human review before any business decision can be made from them. AI Agents Don't Read Data Warehouses. They Read Analytics Estates. explains why the portal layer is the wrong place to look for the fix.
The Reference Architecture That Replaces the Portal
The replacement for a homegrown analytics portal is not a better portal. It is a governed analytics estate with a discovery surface built on top of it.
This architecture has two foundational layers beneath the user interface.
Analytics system of record
The analytics system of record provides a cross-tool, continuously maintained view of every active analytics asset across all BI tools. It delivers: automated ingestion from all BI environments through a single connector framework; certification coverage that designates which assets are authoritative and tracks that designation over time; metric governance that assigns KPI ownership, documents calculation logic, and enforces consistency across tools; and a complete asset inventory that distinguishes active, certified assets from orphaned or duplicate ones.
Atlas builds this through 100+ Smart Connectors that read directly from Power BI, Tableau, SAP Business Objects, Qlik, and other BI environments. The estate becomes visible, inventoried, and governable without requiring a rebuild of the existing BI stack.
Once the estate is governed, the portal layer changes in character. The discovery surface is no longer organizing access to an ungoverned set of assets. It is providing access to certified, defined, and owned analytics resources. The distribution layer is no longer load-bearing on its own.
AI context layer
The AI context layer converts the governed estate into machine-readable form: metric relationships, business logic, and KPI definitions encoded so that AI agents can follow reasoning rather than simply locate data. This is what determines whether an AI copilot returns a trusted answer or a reconciliation problem.
Nexus derives the AI context layer automatically from the analytics system of record Atlas produces. Metric relationships and business logic are encoded from existing BI metadata, without requiring a manual semantic rebuild from scratch. Organizations that add the AI context layer on top of a governed estate close the gap that causes AI copilot deployments to produce conflicting outputs.
How the Transition Works in Practice
The transition from a homegrown analytics portal to a governed analytics estate does not require replacing BI tools. Atlas reads from Power BI, Tableau, SAP Business Objects, Qlik, and other BI environments through Smart Connectors. The existing BI stack stays in place. What changes is the governance and context layer that operates across all of them.
For organizations running multiple distributed portal instances (multiple SharePoint sites, department-level .NET portals, or regional intranet pages), the transition consolidates those instances into a single governed estate. Bimbo Bakeries USA eliminated 25 separate SharePoint sites in this process. The maintenance overhead those sites represented did not migrate to a new portal. It was resolved by governing the estate those sites had been distributing access to.
Organizations implementing this architecture see a 20 to 40% improvement in analytics discovery speed and a 30 to 40% reduction in duplicate reports as inventory and certification are applied across the full estate.
The first move is always cross-tool inventory: a complete, current view of every active analytics asset across all BI tools. Without this, certification programs govern only the fraction of the estate they can see, typically well under half in multi-BI-tool environments. How to Measure Analytics Estate Maturity defines the four stages that track progress from an uncharted estate to an AI-ready one. The Stage 1 to Stage 2 transition, which establishes cross-tool inventory, is the first concrete step for any organization starting from a homegrown portal architecture.
For a broader view of how analytics modernization programs are structured before AI deployment begins, Modernizing the Enterprise Analytics Estate: A Pre-AI Playbook covers the full sequence.
Frequently Asked Questions
What is the difference between an analytics portal and an analytics system of record?
An analytics portal is a distribution layer: it organizes and surfaces analytics assets so users can find them. An analytics system of record is a governance layer: it maintains a complete, certified, and governed view of every analytics asset across all BI tools. A portal tells users where to find reports. An analytics system of record determines which reports are authoritative, who owns each KPI definition, and whether the business logic behind each metric is machine-readable. Both functions matter, but they are not the same function and cannot be provided by the same architecture.
Can we modernize our existing SharePoint analytics portal rather than replace it?
Modernizing the portal interface (improving search, navigation, or access controls) addresses user experience problems but not governance problems. A modernized SharePoint portal is still a distribution layer. It does not certify analytics assets, govern metric definitions, or encode business context for AI. The decision to modernize vs. replace depends on what problem is being solved. If the problem is user experience, portal modernization is relevant. If the problem is AI readiness, ungoverned assets, or conflicting metric definitions across BI tools, those problems require governance infrastructure the portal cannot provide.
Why can't AI copilots use our homegrown analytics portal?
AI copilots and agents read from the analytics estate: the reports, dashboards, KPI definitions, and certified metrics that exist across BI tools. A portal provides a navigation structure for those assets. It does not certify which version of a metric is authoritative, assign ownership to KPI definitions, or encode the business logic AI needs to follow reasoning rather than simply locate data. When an AI agent reads from a portal-backed ungoverned estate, it finds multiple versions of the same metric with no signal about which is correct. The output requires manual reconciliation before it can inform a business decision.
How long does it take to replace a homegrown analytics portal with a governed analytics estate?
The Stage 1 to Stage 2 transition, which establishes cross-tool inventory, can be operational within weeks when inventory is automated through Smart Connectors rather than built manually. Certification coverage across the estate requires organizational coordination and typically progresses over one to three quarters depending on estate size and the number of BI tools involved. The full transition varies by estate size, but the first meaningful milestone (complete cross-tool visibility) is typically faster than organizations expect because it does not require replacing existing BI tools.
What is the first step to modernizing a homegrown analytics portal?
Cross-tool inventory: a complete, current view of every active analytics asset across all BI tools. Organizations that skip this step and begin certification or metric governance programs first are governing only the fraction of the estate they can see, typically well under half the full active estate in multi-BI-tool environments. Inventory completeness is the foundation dimension. Every other governance step and every AI readiness outcome depends on it.
The Analytics Estate Assessment identifies where your current estate sits across inventory, certification, metric governance, and context encoding. It shows which gap to close first. Schedule a 15-minute session to run it with ZenOptics.
Published July 20, 2026